

374
c
Trace Elements in Abiotic and Biotic Environments
TABLE 57.3
Lanthanides in Waters (Mean, ng/L)
Element Seawater a River Water a Rainwater b Soil Solution c Bottled Water d Tap Water d
La
5.6
120
1.68
188.4
3.4
0.2
Ce
0.7
263
1.38
114.5
2.3
1.6
Nd
3.3
152
0.76
58.0
2.9
2.2
Sm
0.6
36
0.63
17.6
1.4
1.5
Eu
0.2
10
0.19
3.9
0.96
2.0
Gd
0.9
40
0.86
19.8
1.6
2.0
Tb
0.2
6
0.22
3.6
0.19
0.2
Dy
1.3
30
1.48
19.0
1.2
1.1
Ho
0.4
7
0.3
3.2
0.54
0.4
Er
1.2
20
0.83
8.7
0.99
8.7
Tm
0.2
3
–
–
0.19
0.2
Yb
1.2
17
0.96
10.9
1.1
1.1
Lu
0.2
2
0.15
1.3
0.23
2.3
a
Sources:
Gaillardet, J. et al., Treatise on Geochemistry, Elsevier, Oxford, 2003.
b Rainwater from Sweden, collected during 1999. Eriksson, J.E., Swedish EPA Report 5159, Stockholm,
Sweden, 2001a.
Soils of the Vosgens Mountains region. Aubert, D. et al., Geochim. Cosmochim. Acta, 19, 3339–3350,
2002.
d Birke, M. et al., J. Geochem. Expl., 107, 217–226, 2010.
d’Aquino et al. 2009). Phosphate fertilizers and some amending materials are their
serious sources (Tables 57.4 and 57.5).
57.3 WATERS
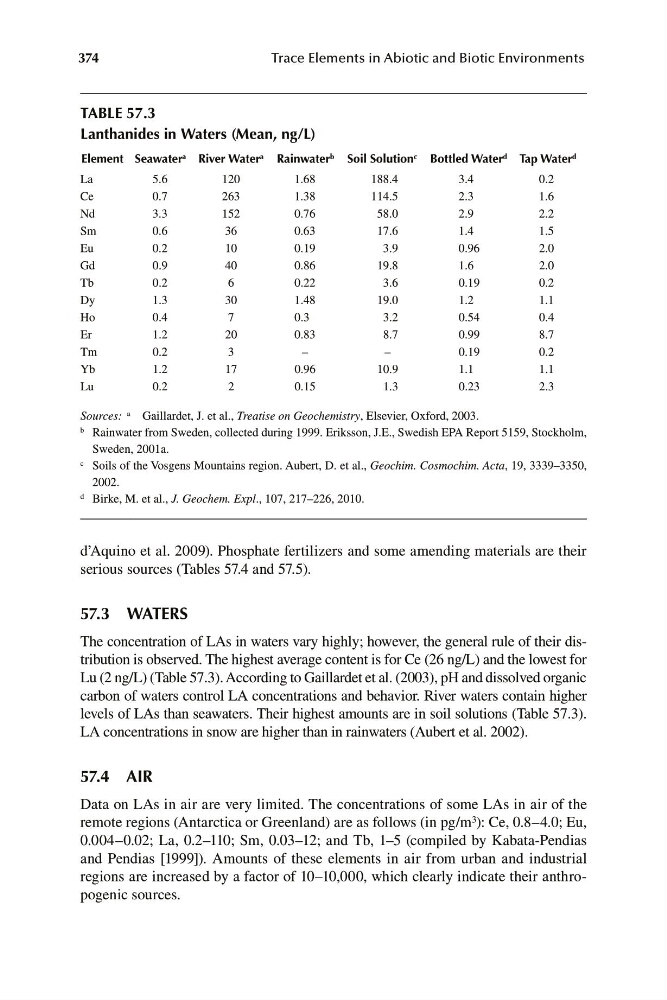
The concentration of LAs in waters vary highly; however, the general rule of their distribution is observed. The highest average content is for Ce (26 ng/L) and the lowest for
Lu (2 ng/L) (Table 57.3). According to Gaillardet et al. (2003), pH and dissolved organic
carbon of waters control LA concentrations and behavior. River waters contain higher
levels of LAs than seawaters. Their highest amounts are in soil solutions (Table 57.3).
LA concentrations in snow are higher than in rainwaters (Aubert et al. 2002).
57.4 AIR
Data on LAs in air are very limited. The concentrations of some LAs in air of the
remote regions (Antarctica or Greenland) are as follows (in pg/m 3 ): Ce, 0.8–4.0; Eu,
0.004–0.02; La, 0.2–110; Sm, 0.03–12; and Tb, 1–5 (compiled by Kabata-Pendias
and Pendias [1999]). Amounts of these elements in air from urban and industrial
regions are increased by a factor of 10–10,000, which clearly indicate their anthropogenic sources.
c
Trace Elements in Abiotic and Biotic Environments
TABLE 57.3
Lanthanides in Waters (Mean, ng/L)
Element Seawater a River Water a Rainwater b Soil Solution c Bottled Water d Tap Water d
La
5.6
120
1.68
188.4
3.4
0.2
Ce
0.7
263
1.38
114.5
2.3
1.6
Nd
3.3
152
0.76
58.0
2.9
2.2
Sm
0.6
36
0.63
17.6
1.4
1.5
Eu
0.2
10
0.19
3.9
0.96
2.0
Gd
0.9
40
0.86
19.8
1.6
2.0
Tb
0.2
6
0.22
3.6
0.19
0.2
Dy
1.3
30
1.48
19.0
1.2
1.1
Ho
0.4
7
0.3
3.2
0.54
0.4
Er
1.2
20
0.83
8.7
0.99
8.7
Tm
0.2
3
–
–
0.19
0.2
Yb
1.2
17
0.96
10.9
1.1
1.1
Lu
0.2
2
0.15
1.3
0.23
2.3
a
Sources:
Gaillardet, J. et al., Treatise on Geochemistry, Elsevier, Oxford, 2003.
b Rainwater from Sweden, collected during 1999. Eriksson, J.E., Swedish EPA Report 5159, Stockholm,
Sweden, 2001a.
Soils of the Vosgens Mountains region. Aubert, D. et al., Geochim. Cosmochim. Acta, 19, 3339–3350,
2002.
d Birke, M. et al., J. Geochem. Expl., 107, 217–226, 2010.
d’Aquino et al. 2009). Phosphate fertilizers and some amending materials are their
serious sources (Tables 57.4 and 57.5).
57.3 WATERS
The concentration of LAs in waters vary highly; however, the general rule of their distribution is observed. The highest average content is for Ce (26 ng/L) and the lowest for
Lu (2 ng/L) (Table 57.3). According to Gaillardet et al. (2003), pH and dissolved organic
carbon of waters control LA concentrations and behavior. River waters contain higher
levels of LAs than seawaters. Their highest amounts are in soil solutions (Table 57.3).
LA concentrations in snow are higher than in rainwaters (Aubert et al. 2002).
57.4 AIR
Data on LAs in air are very limited. The concentrations of some LAs in air of the
remote regions (Antarctica or Greenland) are as follows (in pg/m 3 ): Ce, 0.8–4.0; Eu,
0.004–0.02; La, 0.2–110; Sm, 0.03–12; and Tb, 1–5 (compiled by Kabata-Pendias
and Pendias [1999]). Amounts of these elements in air from urban and industrial
regions are increased by a factor of 10–10,000, which clearly indicate their anthropogenic sources.