

291
Selenium [Se, 34]
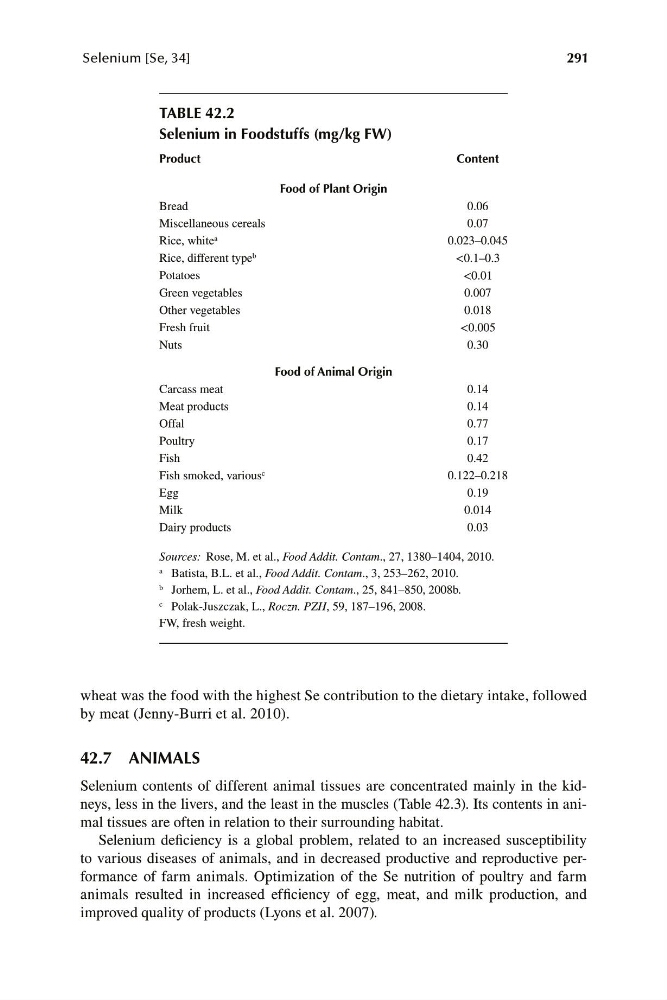
TABLE 42.2
Selenium in Foodstuffs (mg/kg FW)
Product
Content
Bread
Food of Plant Origin
0.06
Miscellaneous cereals
0.07
Rice, white a
Rice, different type b
Potatoes
0.023–0.045
<0.1–0.3
<0.01
Green vegetables
Other vegetables
Fresh fruit
0.007
0.018
<0.005
Nuts
0.30
Carcass meat
Food of Animal Origin
0.14
Meat products
Offal
0.14
0.77
Poultry
Fish
0.17
0.42
Fish smoked, various c
Egg
Milk
0.122–0.218
0.19
0.014
Dairy products
0.03
Sources: Rose, M. et al., Food Addit. Contam., 27, 1380–1404, 2010.
a Batista, B.L. et al., Food Addit. Contam., 3, 253–262, 2010.
b Jorhem, L. et al., Food Addit. Contam., 25, 841–850, 2008b.
c Polak-Juszczak, L., Roczn. PZH, 59, 187–196, 2008.
FW, fresh weight.
wheat was the food with the highest Se contribution to the dietary intake, followed
by meat (Jenny-Burri et al. 2010).
42.7 ANIMALS
Selenium contents of different animal tissues are concentrated mainly in the kidneys, less in the livers, and the least in the muscles (Table 42.3). Its contents in animal tissues are often in relation to their surrounding habitat.
Selenium deficiency is a global problem, related to an increased susceptibility
to various diseases of animals, and in decreased productive and reproductive performance of farm animals. Optimization of the Se nutrition of poultry and farm
animals resulted in increased efficiency of egg, meat, and milk production, and
improved quality of products (Lyons et al. 2007).