

211
Mercury [Hg, 80]
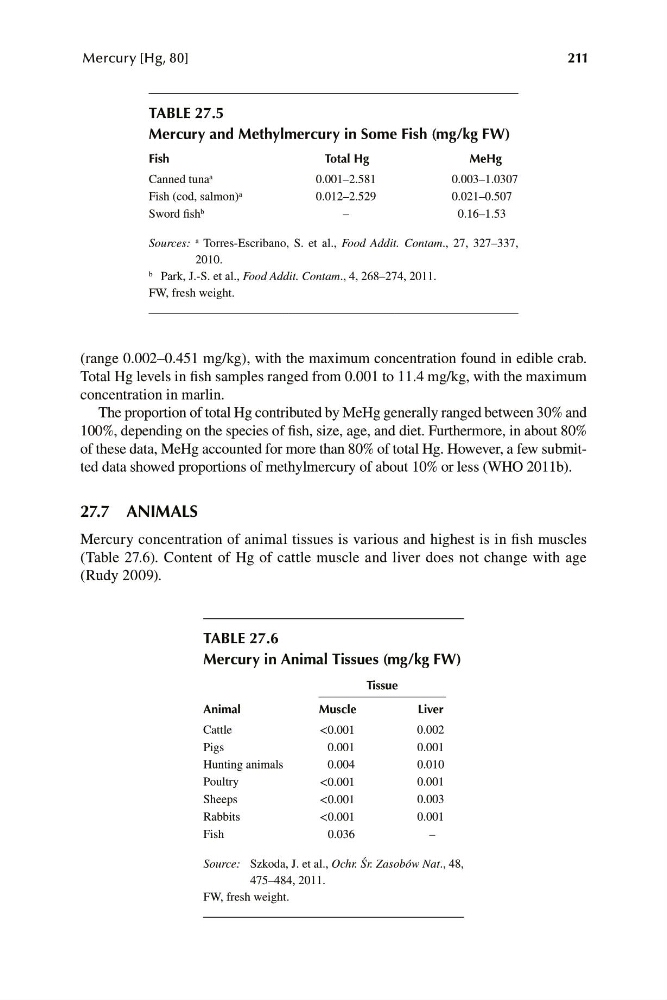
TABLE 27.5
Mercury and Methylmercury in Some Fish (mg/kg FW)
Fish
Total Hg
MeHg
Canned tuna a
0.001–2.581
0.003–1.0307
Fish (cod, salmon) a
Sword fish b
0.012–2.529
–
0.021–0.507
0.16–1.53
a
Sources: Torres-Escribano, S. et al., Food Addit. Contam., 27, 327–337,
2010.
b Park, J.-S. et al., Food Addit. Contam., 4, 268–274, 2011.
FW, fresh weight.
(range 0.002–0.451 mg/kg), with the maximum concentration found in edible crab.
Total Hg levels in fish samples ranged from 0.001 to 11.4 mg/kg, with the maximum
concentration in marlin.
The proportion of total Hg contributed by MeHg generally ranged between 30% and
100%, depending on the species of fish, size, age, and diet. Furthermore, in about 80%
of these data, MeHg accounted for more than 80% of total Hg. However, a few submitted data showed proportions of methylmercury of about 10% or less (WHO 2011b).
27.7 ANIMALS
Mercury concentration of animal tissues is various and highest is in fish muscles
(Table 27.6). Content of Hg of cattle muscle and liver does not change with age
(Rudy 2009).
TABLE 27.6
Mercury in Animal Tissues (mg/kg FW)
Tissue
Animal
Muscle
Liver
Cattle
<0.001
0.002
Pigs
0.001
0.001
Hunting animals
0.004
0.010
Poultry
<0.001
0.001
Sheeps
<0.001
0.003
Rabbits
<0.001
0.001
Fish
0.036
–
Source: Szkoda, J. et al., Ochr. Śr. Zasobów Nat., 48,
475–484, 2011.
FW, fresh weight.