

210
Trace Elements in Abiotic and Biotic Environments
TABLE 27.4
Total Hg in Foodstuffs (mg/kg FW)
Product
Content
Food of Plant Origin
Bread a
<0.003
Miscellaneous cereals a
<0.003
Wheat b
0.0028
Rye b
0.0020
Green vegetables a
<0.0005
Cabbage b
0.0005
Potatoes b
0.0006
Mushroom fresh, various c
0.028
Apple b
0.0004
Food of Animal Origin
Meat and meat products a
<0.002
Offal a
0.004
Freshwater fish d
0.01–0.19
Fish a
0.056
Shellfish e
0.017
Fish f
0.006–1.5
Seafood other than fish f
0.004–0.067
Sources: a Rose, M. et al., Food Addit. Contam., 27, 1380–1404, 2010.
b Jędrzejczak, R., Food Addit. Contam., 19, 996–1002, 2002.
c Wojciechowska-Mazurek, M. et al. Bromat. Chem. Toksykol., 44,
143–149, 2011.
d Lidwin-Kaźmierkiewicz, M. et al., Pol. J. Food Nutr. Sci., 59,
219–234, 2009.
e Leblanc, J.C. et al., Food Addit. Contam., 22, 624–641, 2005.
f Chung, S.W.C. et al., Food Addit. Contam., 25, 831–840, 2008.
FW, fresh weight.
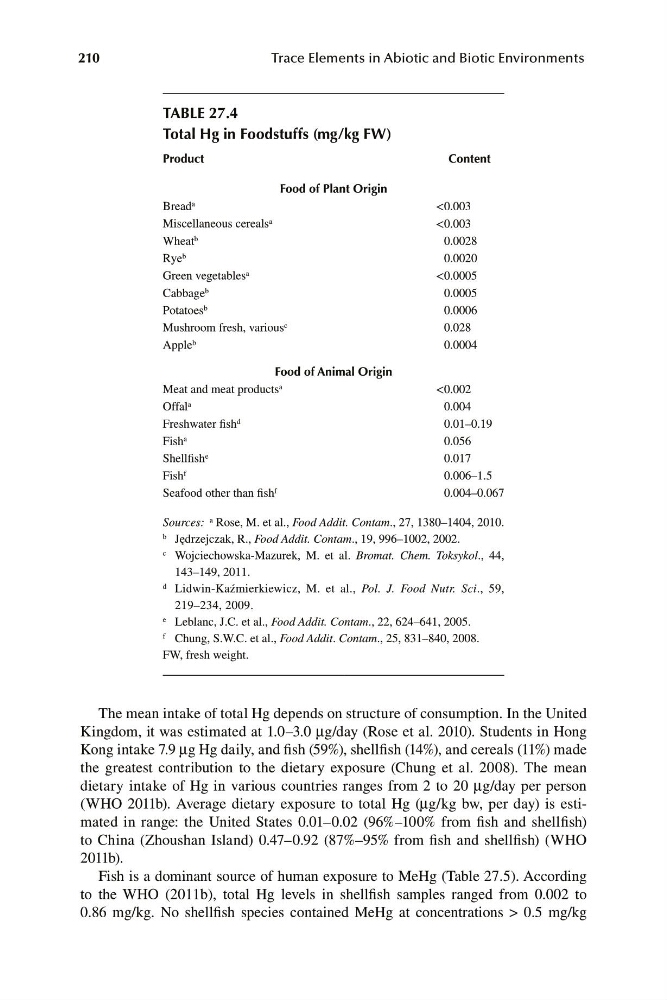
The mean intake of total Hg depends on structure of consumption. In the United
Kingdom, it was estimated at 1.0–3.0 μg/day (Rose et al. 2010). Students in Hong
Kong intake 7.9 μg Hg daily, and fish (59%), shellfish (14%), and cereals (11%) made
the greatest contribution to the dietary exposure (Chung et al. 2008). The mean
dietary intake of Hg in various countries ranges from 2 to 20 μg/day per person
(WHO 2011b). Average dietary exposure to total Hg (μg/kg bw, per day) is estimated in range: the United States 0.01–0.02 (96%–100% from fish and shellfish)
to China (Zhoushan Island) 0.47–0.92 (87%–95% from fish and shellfish) (WHO
2011b).
Fish is a dominant source of human exposure to MeHg (Table 27.5). According
to the WHO (2011b), total Hg levels in shellfish samples ranged from 0.002 to
0.86 mg/kg. No shellfish species contained MeHg at concentrations > 0.5 mg/kg