

106
Trace Elements in Abiotic and Biotic Environments
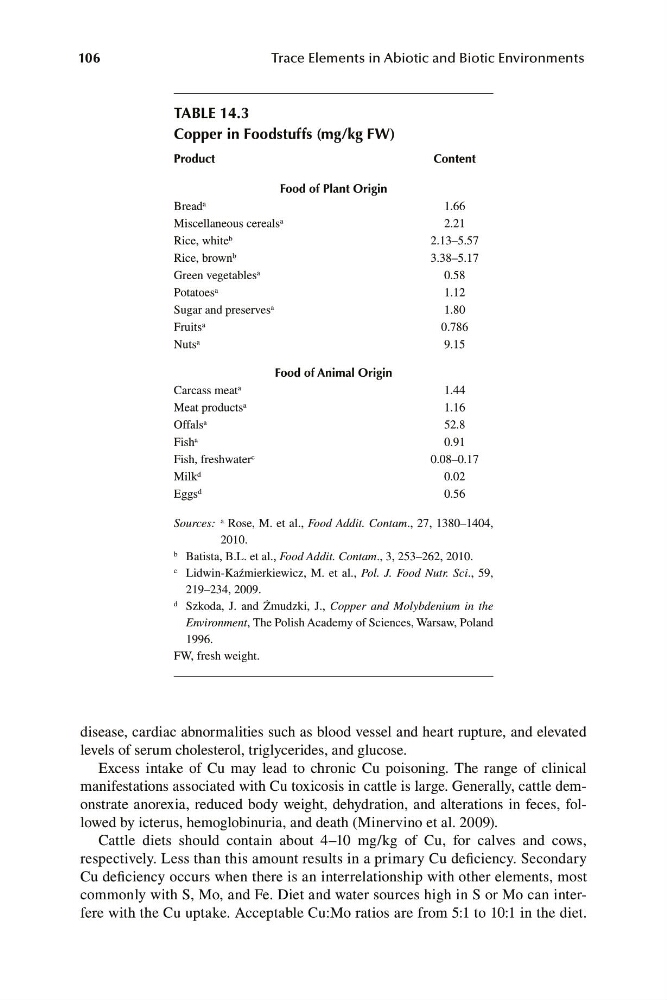
TABLE 14.3
Copper in Foodstuffs (mg/kg FW)
Product
Content
Food of Plant Origin
Bread a
1.66
Miscellaneous cereals a
2.21
Rice, white b
2.13–5.57
Rice, brown b
3.38–5.17
Green vegetables a
0.58
Potatoes a
1.12
Sugar and preserves a
1.80
Fruits a
0.786
Nuts a
9.15
Food of Animal Origin
Carcass meat a
1.44
Meat products a
1.16
Offals a
52.8
Fish a
0.91
Fish, freshwater c
0.08–0.17
Milk d
0.02
Eggs d
0.56
a
Sources: Rose, M. et al., Food Addit. Contam., 27, 1380–1404,
2010.
b Batista, B.L. et al., Food Addit. Contam., 3, 253–262, 2010.
c Lidwin-Kaźmierkiewicz, M. et al., Pol. J. Food Nutr. Sci., 59,
219–234, 2009.
d Szkoda, J. and Żmudzki, J., Copper and Molybdenium in the
Environment, The Polish Academy of Sciences, Warsaw, Poland
1996.
FW, fresh weight.
disease, cardiac abnormalities such as blood vessel and heart rupture, and elevated
levels of serum cholesterol, triglycerides, and glucose.
Excess intake of Cu may lead to chronic Cu poisoning. The range of clinical
manifestations associated with Cu toxicosis in cattle is large. Generally, cattle demonstrate anorexia, reduced body weight, dehydration, and alterations in feces, followed by icterus, hemoglobinuria, and death (Minervino et al. 2009).
Cattle diets should contain about 4–10 mg/kg of Cu, for calves and cows,
respectively. Less than this amount results in a primary Cu deficiency. Secondary
Cu deficiency occurs when there is an interrelationship with other elements, most
commonly with S, Mo, and Fe. Diet and water sources high in S or Mo can interfere with the Cu uptake. Acceptable Cu:Mo ratios are from 5:1 to 10:1 in the diet.