

Figure 10.10
209
Bacterial Nanocellulose Biomaterials with Controlled Architecture
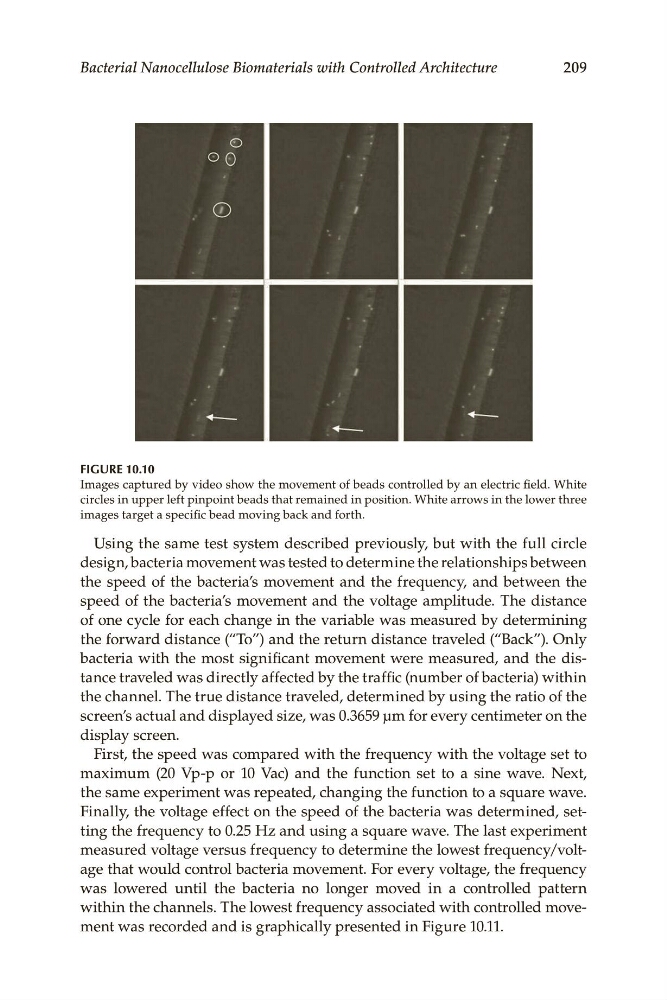
Figure 10.10
Images.captured.by.video.show.the.movement.of.beads.controlled.by.an.electric.field..White.
circles.in.upper.left.pinpoint.beads.that.remained.in.position..White.arrows.in.the.lower.three.
images.target.a.specific.bead.moving.back.and.forth.
Using.the.same.test.system.described.previously,.but.with.the.full.circle.
design,.bacteria.movement.was.tested.to.determine.the.relationships.between.
the. speed. of. the. bacteria’s. movement. and. the. frequency,. and. between. the.
speed.of.the.bacteria’s.movement.and.the.voltage.amplitude.. The.distance.
of.one.cycle.for.each.change.in.the.variable.was.measured.by.determining.
the.forward.distance.(“To”).and.the.return.distance.traveled.(“Back”)..Only.
. bacteria. with. the. most. significant. movement. were. measured,. and. the. distance.traveled.was.directly.affected.by.the.traffic.(number.of.bacteria).within.
the.channel..The.true.distance.traveled,.determined.by.using.the.ratio.of.the.
screen’s.actual.and.displayed.size,.was.0.3659.μm.for.every.centimeter.on.the.
display.screen.
First,.the.speed.was.compared.with.the.frequency.with.the.voltage.set.to.
maximum. (20. Vp-p. or. 10. Vac). and. the. function. set. to. a. sine. wave.. Next,.
the.same.experiment.was.repeated,.changing.the.function.to.a.square.wave..
Finally,.the.voltage.effect.on.the.speed.of.the.bacteria.was.determined,.setting.the.frequency.to.0.25.Hz.and.using.a.square.wave..The.last.experiment.
measured.voltage.versus.frequency.to.determine.the.lowest.frequency/voltage.that.would.control.bacteria.movement..For.every.voltage,.the.frequency.
was. lowered. until. the. bacteria. no. longer. moved. in. a. controlled. pattern.
within.the.channels..The.lowest.frequency.associated.with.controlled.movement.was.recorded.and.is.graphically.presented.in.Figure 10.11.
209
Bacterial Nanocellulose Biomaterials with Controlled Architecture
Figure 10.10
Images.captured.by.video.show.the.movement.of.beads.controlled.by.an.electric.field..White.
circles.in.upper.left.pinpoint.beads.that.remained.in.position..White.arrows.in.the.lower.three.
images.target.a.specific.bead.moving.back.and.forth.
Using.the.same.test.system.described.previously,.but.with.the.full.circle.
design,.bacteria.movement.was.tested.to.determine.the.relationships.between.
the. speed. of. the. bacteria’s. movement. and. the. frequency,. and. between. the.
speed.of.the.bacteria’s.movement.and.the.voltage.amplitude.. The.distance.
of.one.cycle.for.each.change.in.the.variable.was.measured.by.determining.
the.forward.distance.(“To”).and.the.return.distance.traveled.(“Back”)..Only.
. bacteria. with. the. most. significant. movement. were. measured,. and. the. distance.traveled.was.directly.affected.by.the.traffic.(number.of.bacteria).within.
the.channel..The.true.distance.traveled,.determined.by.using.the.ratio.of.the.
screen’s.actual.and.displayed.size,.was.0.3659.μm.for.every.centimeter.on.the.
display.screen.
First,.the.speed.was.compared.with.the.frequency.with.the.voltage.set.to.
maximum. (20. Vp-p. or. 10. Vac). and. the. function. set. to. a. sine. wave.. Next,.
the.same.experiment.was.repeated,.changing.the.function.to.a.square.wave..
Finally,.the.voltage.effect.on.the.speed.of.the.bacteria.was.determined,.setting.the.frequency.to.0.25.Hz.and.using.a.square.wave..The.last.experiment.
measured.voltage.versus.frequency.to.determine.the.lowest.frequency/voltage.that.would.control.bacteria.movement..For.every.voltage,.the.frequency.
was. lowered. until. the. bacteria. no. longer. moved. in. a. controlled. pattern.
within.the.channels..The.lowest.frequency.associated.with.controlled.movement.was.recorded.and.is.graphically.presented.in.Figure 10.11.