

Figure 10.9
Figure 10.8
208
Bacterial Cellulose
Figure 10.8
Example.of.a.PDMS.mold.produced.from.the.silicon.master.
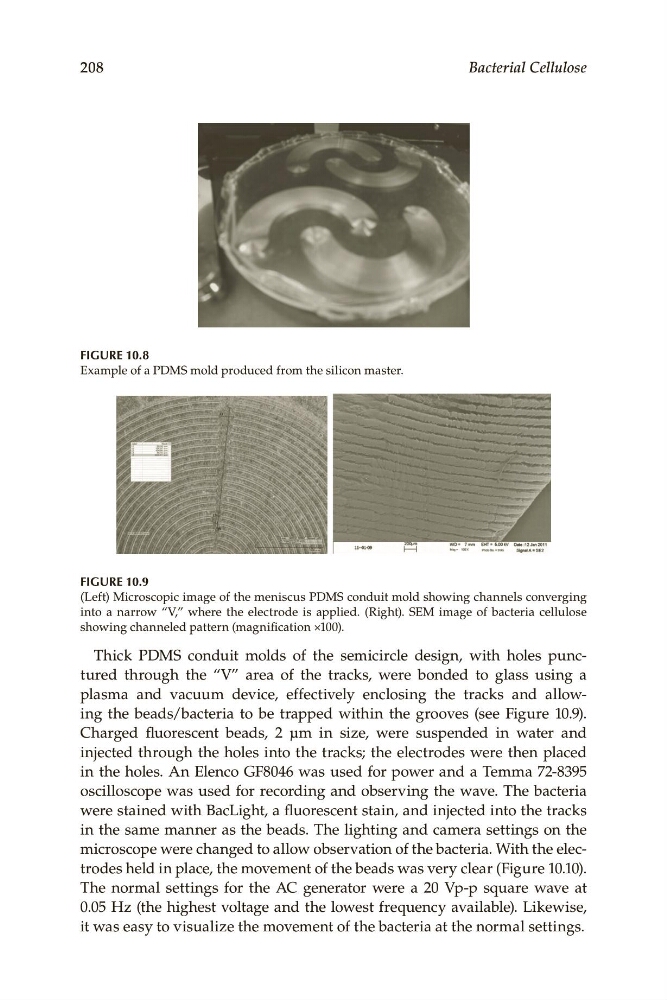
Figure 10.9
(Left).Microscopic.image.of.the.meniscus.PDMS.conduit.mold.showing.channels.converging.
into. a. narrow. “V,”. where. the. electrode. is. applied.. (Right).. SEM. image. of. bacteria. cellulose.
showing.channeled.pattern.(magnification.×100).
Thick. PDMS. conduit. molds. of. the. semicircle. design,. with. holes. punctured. through. the. “V”. area. of. the. tracks,. were. bonded. to. glass. using. a.
plasma. and. vacuum. device,. effectively. enclosing. the. tracks. and. allowing. the. beads/bacteria. to. be. trapped. within. the. grooves. (see. Figure 10.9)..
Charged. fluorescent. beads,. 2. μm. in. size,. were. suspended. in. water. and.
injected.through.the.holes.into.the.tracks;.the.electrodes.were.then.placed.
in.the.holes..An.Elenco.GF8046.was.used.for.power.and.a.Temma.72-8395.
oscilloscope.was.used.for.recording.and.observing.the.wave..The.bacteria.
were.stained.with.BacLight,.a.fluorescent.stain,.and.injected.into.the.tracks.
in.the.same.manner.as.the.beads..The.lighting.and.camera.settings.on.the.
microscope.were.changed.to.allow.observation.of.the.bacteria..With.the.electrodes.held.in.place,.the.movement.of.the.beads.was.very.clear.(Figure 10.10)..
The. normal. settings. for. the. AC. generator. were. a. 20. Vp-p. square. wave. at.
0.05 Hz.(the highest.voltage.and.the.lowest.frequency.available)..Likewise,.
it.was.easy.to.visualize.the.movement.of.the.bacteria.at.the.normal.settings.
Figure 10.8
208
Bacterial Cellulose
Figure 10.8
Example.of.a.PDMS.mold.produced.from.the.silicon.master.
Figure 10.9
(Left).Microscopic.image.of.the.meniscus.PDMS.conduit.mold.showing.channels.converging.
into. a. narrow. “V,”. where. the. electrode. is. applied.. (Right).. SEM. image. of. bacteria. cellulose.
showing.channeled.pattern.(magnification.×100).
Thick. PDMS. conduit. molds. of. the. semicircle. design,. with. holes. punctured. through. the. “V”. area. of. the. tracks,. were. bonded. to. glass. using. a.
plasma. and. vacuum. device,. effectively. enclosing. the. tracks. and. allowing. the. beads/bacteria. to. be. trapped. within. the. grooves. (see. Figure 10.9)..
Charged. fluorescent. beads,. 2. μm. in. size,. were. suspended. in. water. and.
injected.through.the.holes.into.the.tracks;.the.electrodes.were.then.placed.
in.the.holes..An.Elenco.GF8046.was.used.for.power.and.a.Temma.72-8395.
oscilloscope.was.used.for.recording.and.observing.the.wave..The.bacteria.
were.stained.with.BacLight,.a.fluorescent.stain,.and.injected.into.the.tracks.
in.the.same.manner.as.the.beads..The.lighting.and.camera.settings.on.the.
microscope.were.changed.to.allow.observation.of.the.bacteria..With.the.electrodes.held.in.place,.the.movement.of.the.beads.was.very.clear.(Figure 10.10)..
The. normal. settings. for. the. AC. generator. were. a. 20. Vp-p. square. wave. at.
0.05 Hz.(the highest.voltage.and.the.lowest.frequency.available)..Likewise,.
it.was.easy.to.visualize.the.movement.of.the.bacteria.at.the.normal.settings.