

Figure 10.5
Figure 10.6
206
Bacterial Cellulose
–0.6
–0.4
–0.2
0
0.2
0
0.2
0
0.2
0.4
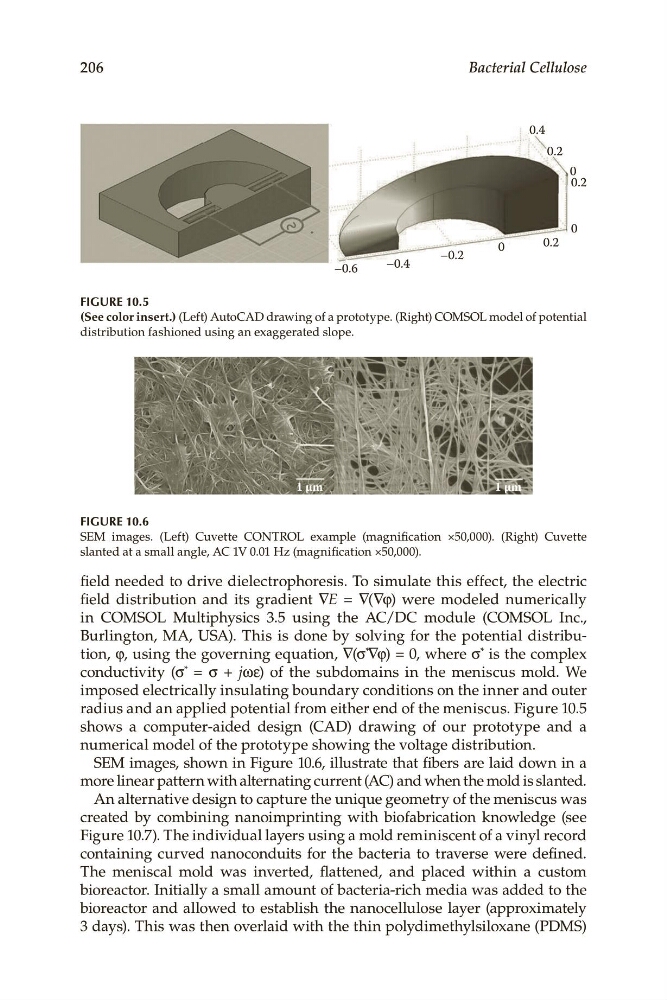
Figure 10.5
(See color insert.) (Left).AutoCAD.drawing.of.a.prototype..(Right).COMSOL.model.of.potential.
distribution.fashioned.using.an.exaggerated.slope.
1 µm
1 µm
Figure 10.6
SEM. images.. (Left). Cuvette. CONTROL. example. (magnification. ×50,000).. (Right). Cuvette.
slanted.at.a.small.angle,.AC.1V.0.01.Hz.(magnification.×50,000).
field.needed.to.drive.dielectrophoresis..To.simulate.this.effect,.the.electric.
field. distribution. and. its. gradient. ∇E. =. ∇(∇φ). were. modeled. numerically.
in. COMSOL. Multiphysics. 3.5. using. the. AC/DC. module. (COMSOL. Inc.,.
Burlington,. MA,. USA).. This. is. done. by. solving. for. the. potential. distribution,.φ,.using.the.governing.equation,.∇(σ * ∇φ).=.0,.where.σ * .is.the.complex.
conductivity. (σ * . =. σ. +. jωε). of. the. subdomains. in. the. meniscus. mold.. We.
imposed.electrically.insulating.boundary.conditions.on.the.inner.and.outer.
radius.and.an.applied.potential.from.either.end.of.the.meniscus..Figure 10.5.
shows. a. computer-aided. design. (CAD). drawing. of. our. prototype. and. a.
numerical.model.of.the.prototype.showing.the.voltage.distribution.
SEM.images,.shown.in.Figure 10.6,.illustrate.that.fibers.are.laid.down.in.a.
more.linear.pattern.with.alternating.current.(AC).and.when.the.mold.is.slanted.
An.alternative.design.to.capture.the.unique.geometry.of.the.meniscus.was.
created. by. combining. nanoimprinting. with. biofabrication. knowledge. (see.
Figure 10.7)..The.individual.layers.using.a.mold.reminiscent.of.a.vinyl.record.
containing. curved. nanoconduits. for. the. bacteria. to. traverse. were. defined..
The. meniscal. mold. was. inverted,. flattened,. and. placed. within. a. custom.
bioreactor..Initially.a.small.amount.of.bacteria-rich.media.was.added.to.the.
bioreactor.and.allowed.to.establish.the.nanocellulose.layer.(approximately.
3.days)..This.was.then.overlaid.with.the.thin.polydimethylsiloxane.(PDMS).
Figure 10.6
206
Bacterial Cellulose
–0.6
–0.4
–0.2
0
0.2
0
0.2
0
0.2
0.4
Figure 10.5
(See color insert.) (Left).AutoCAD.drawing.of.a.prototype..(Right).COMSOL.model.of.potential.
distribution.fashioned.using.an.exaggerated.slope.
1 µm
1 µm
Figure 10.6
SEM. images.. (Left). Cuvette. CONTROL. example. (magnification. ×50,000).. (Right). Cuvette.
slanted.at.a.small.angle,.AC.1V.0.01.Hz.(magnification.×50,000).
field.needed.to.drive.dielectrophoresis..To.simulate.this.effect,.the.electric.
field. distribution. and. its. gradient. ∇E. =. ∇(∇φ). were. modeled. numerically.
in. COMSOL. Multiphysics. 3.5. using. the. AC/DC. module. (COMSOL. Inc.,.
Burlington,. MA,. USA).. This. is. done. by. solving. for. the. potential. distribution,.φ,.using.the.governing.equation,.∇(σ * ∇φ).=.0,.where.σ * .is.the.complex.
conductivity. (σ * . =. σ. +. jωε). of. the. subdomains. in. the. meniscus. mold.. We.
imposed.electrically.insulating.boundary.conditions.on.the.inner.and.outer.
radius.and.an.applied.potential.from.either.end.of.the.meniscus..Figure 10.5.
shows. a. computer-aided. design. (CAD). drawing. of. our. prototype. and. a.
numerical.model.of.the.prototype.showing.the.voltage.distribution.
SEM.images,.shown.in.Figure 10.6,.illustrate.that.fibers.are.laid.down.in.a.
more.linear.pattern.with.alternating.current.(AC).and.when.the.mold.is.slanted.
An.alternative.design.to.capture.the.unique.geometry.of.the.meniscus.was.
created. by. combining. nanoimprinting. with. biofabrication. knowledge. (see.
Figure 10.7)..The.individual.layers.using.a.mold.reminiscent.of.a.vinyl.record.
containing. curved. nanoconduits. for. the. bacteria. to. traverse. were. defined..
The. meniscal. mold. was. inverted,. flattened,. and. placed. within. a. custom.
bioreactor..Initially.a.small.amount.of.bacteria-rich.media.was.added.to.the.
bioreactor.and.allowed.to.establish.the.nanocellulose.layer.(approximately.
3.days)..This.was.then.overlaid.with.the.thin.polydimethylsiloxane.(PDMS).