

318
Xenopus
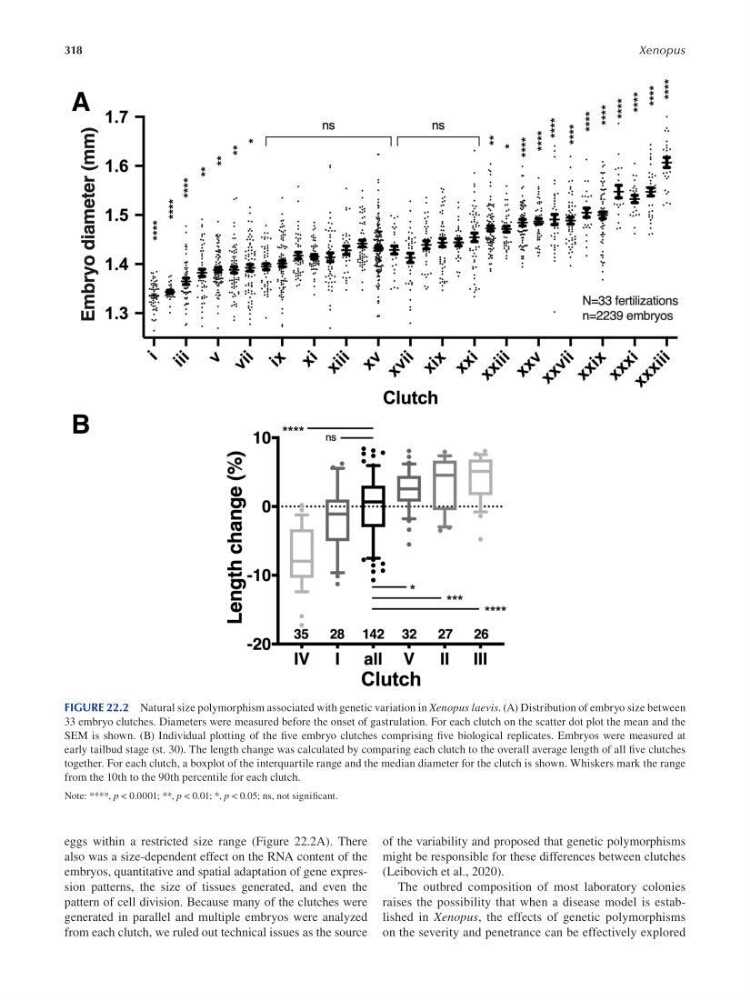
FIGURE 22.2 Natural size polymorphism associated with genetic variation in Xenopus laevis. (A) Distribution of embryo size between
33 embryo clutches. Diameters were measured before the onset of gastrulation. For each clutch on the scatter dot plot the mean and the
SEM is shown. (B) Individual plotting of the fve embryo clutches comprising fve biological replicates. Embryos were measured at
early tailbud stage (st. 30). The length change was calculated by comparing each clutch to the overall average length of all f ve clutches
together. For each clutch, a boxplot of the interquartile range and the median diameter for the clutch is shown. Whiskers mark the range
from the 10th to the 90th percentile for each clutch.
Note: ****, p < 0.0001; **, p < 0.01; *, p < 0.05; ns, not signif cant.
eggs within a restricted size range ( Figure 22.2A ). There of the variability and proposed that genetic polymorphisms
also was a size-dependent effect on the RNA content of the might be responsible for these differences between clutches
embryos, quantitative and spatial adaptation of gene expres- ( Leibovich et al., 2020 ).
sion patterns, the size of tissues generated, and even the
The outbred composition of most laboratory colonies
pattern of cell division. Because many of the clutches were raises the possibility that when a disease model is estabgenerated in parallel and multiple embryos were analyzed lished in Xenopus, the effects of genetic polymorphisms
from each clutch, we ruled out technical issues as the source on the severity and penetrance can be effectively explored
Xenopus
FIGURE 22.2 Natural size polymorphism associated with genetic variation in Xenopus laevis. (A) Distribution of embryo size between
33 embryo clutches. Diameters were measured before the onset of gastrulation. For each clutch on the scatter dot plot the mean and the
SEM is shown. (B) Individual plotting of the fve embryo clutches comprising fve biological replicates. Embryos were measured at
early tailbud stage (st. 30). The length change was calculated by comparing each clutch to the overall average length of all f ve clutches
together. For each clutch, a boxplot of the interquartile range and the median diameter for the clutch is shown. Whiskers mark the range
from the 10th to the 90th percentile for each clutch.
Note: ****, p < 0.0001; **, p < 0.01; *, p < 0.05; ns, not signif cant.
eggs within a restricted size range ( Figure 22.2A ). There of the variability and proposed that genetic polymorphisms
also was a size-dependent effect on the RNA content of the might be responsible for these differences between clutches
embryos, quantitative and spatial adaptation of gene expres- ( Leibovich et al., 2020 ).
sion patterns, the size of tissues generated, and even the
The outbred composition of most laboratory colonies
pattern of cell division. Because many of the clutches were raises the possibility that when a disease model is estabgenerated in parallel and multiple embryos were analyzed lished in Xenopus, the effects of genetic polymorphisms
from each clutch, we ruled out technical issues as the source on the severity and penetrance can be effectively explored