

Analytica Chimica Acta, accepted, 07/07/2015. This is the accepted version without proofing
corrections. DOI: 10.1016/j.aca.2015.06.011
.
Page 22 of 26
Figure S-6: Landscape plots showing the reconstructed pure MCR components for a) HH polarized TSFS, b)
VV polarized TSFS, and c) HH polarized EEM generated from the TSFS data. For components, 1, 2, and 4 the
contour lines have the same separation. For component 3, the contour line separation is much less because of
the weakness of the signal.
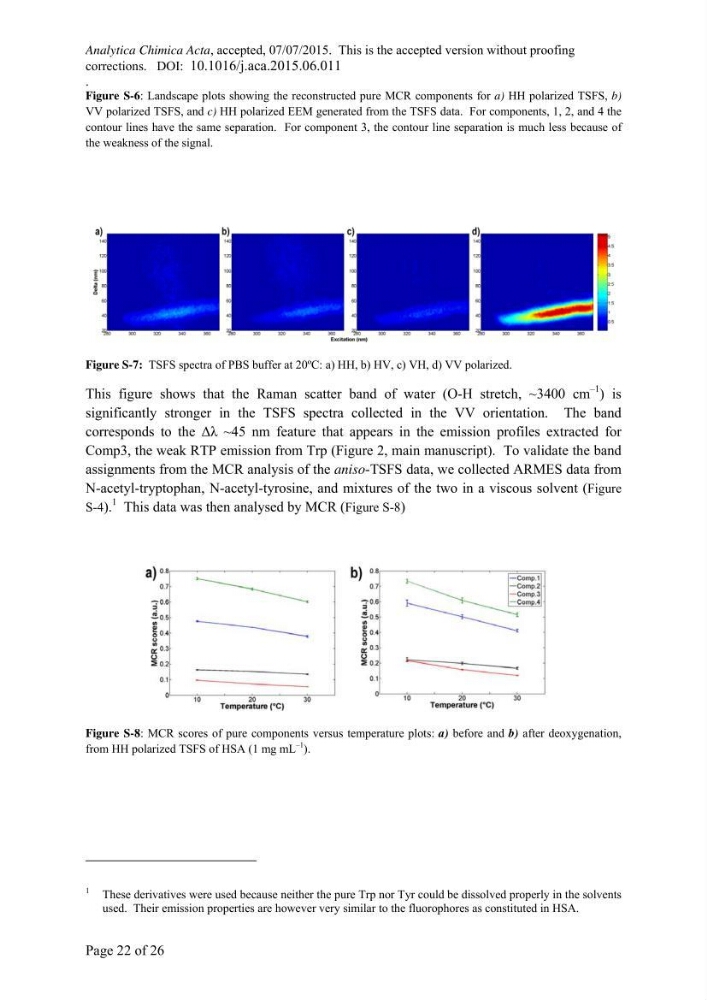
Figure S-7: TSFS spectra of PBS buffer at 20ºC: a) HH, b) HV, c) VH, d) VV polarized.
This figure shows that the Raman scatter band of water (O-H stretch, ~3400 cm
–1
) is
significantly stronger in the TSFS spectra collected in the VV orientation. The band
corresponds to the Δλ ~45 nm feature that appears in the emission profiles extracted for
Comp3, the weak RTP emission from Trp (Figure 2, main manuscript). To validate the band
assignments from the MCR analysis of the aniso-TSFS data, we collected ARMES data from
N-acetyl-tryptophan, N-acetyl-tyrosine, and mixtures of the two in a viscous solvent (Figure
S-4).
1
This data was then analysed by MCR (Figure S-8)
Figure S-8: MCR scores of pure components versus temperature plots: a) before and b) after deoxygenation,
from HH polarized TSFS of HSA (1 mg mL
–1
).
1
These derivatives were used because neither the pure Trp nor Tyr could be dissolved properly in the solvents
used. Their emission properties are however very similar to the fluorophores as constituted in HSA.
corrections. DOI: 10.1016/j.aca.2015.06.011
.
Page 22 of 26
Figure S-6: Landscape plots showing the reconstructed pure MCR components for a) HH polarized TSFS, b)
VV polarized TSFS, and c) HH polarized EEM generated from the TSFS data. For components, 1, 2, and 4 the
contour lines have the same separation. For component 3, the contour line separation is much less because of
the weakness of the signal.
Figure S-7: TSFS spectra of PBS buffer at 20ºC: a) HH, b) HV, c) VH, d) VV polarized.
This figure shows that the Raman scatter band of water (O-H stretch, ~3400 cm
–1
) is
significantly stronger in the TSFS spectra collected in the VV orientation. The band
corresponds to the Δλ ~45 nm feature that appears in the emission profiles extracted for
Comp3, the weak RTP emission from Trp (Figure 2, main manuscript). To validate the band
assignments from the MCR analysis of the aniso-TSFS data, we collected ARMES data from
N-acetyl-tryptophan, N-acetyl-tyrosine, and mixtures of the two in a viscous solvent (Figure
S-4).
1
This data was then analysed by MCR (Figure S-8)
Figure S-8: MCR scores of pure components versus temperature plots: a) before and b) after deoxygenation,
from HH polarized TSFS of HSA (1 mg mL
–1
).
1
These derivatives were used because neither the pure Trp nor Tyr could be dissolved properly in the solvents
used. Their emission properties are however very similar to the fluorophores as constituted in HSA.