

4.3
Combining Predictors in an Ensemble
As was explained in Sec. 3.4, an ensemble is a committee of predictors, where the opinion of each member of the ensemble
is sought when performing predictions. In this case, it is proposed to use the kNN, NN and PLS algorithms as members of
the ensemble, and to simply average the predictions from each to arrive at a final prediction. (It would be possible to use a
weighted average if independent experiments had established the relative accuracy of each, but lack of data prevents that
from being done in this case.)
As was mentioned previously, for the accuracy of an ensemble to be greater on average than that of any of its members, it is
necessary and sufficient that each member is accurate and that the predictions produced by members are diverse
17
. Figure 3
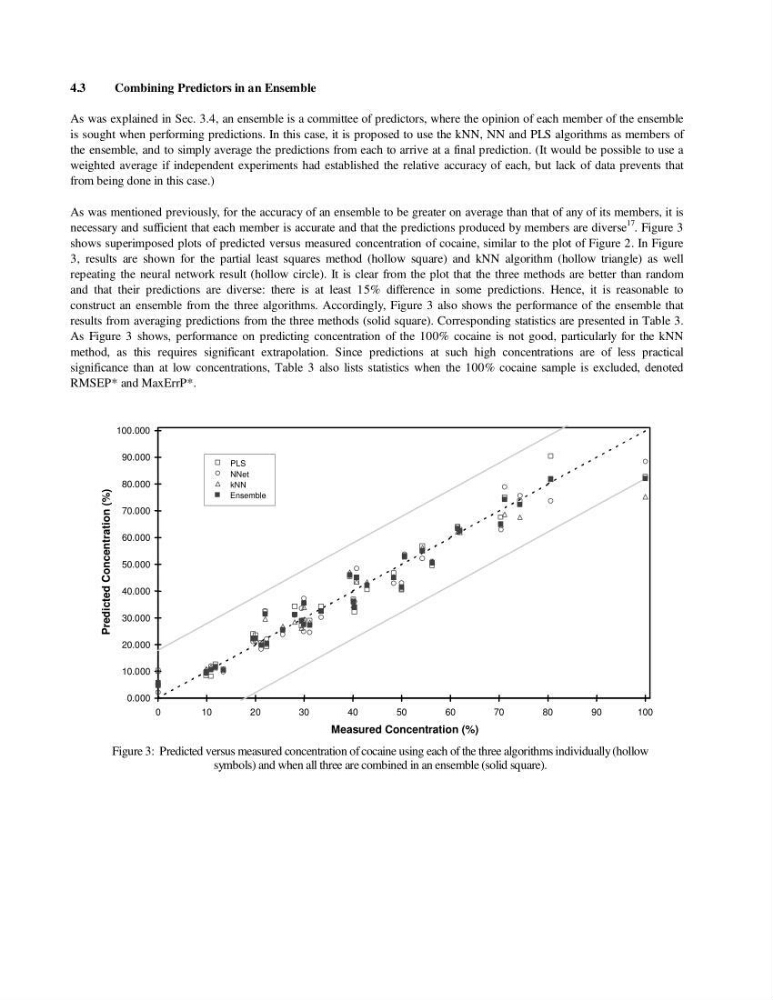
shows superimposed plots of predicted versus measured concentration of cocaine, similar to the plot of Figure 2. In Figure
3, results are shown for the partial least squares method (hollow square) and kNN algorithm (hollow triangle) as well
repeating the neural network result (hollow circle). It is clear from the plot that the three methods are better than random
and that their predictions are diverse: there is at least 15% difference in some predictions. Hence, it is reasonable to
construct an ensemble from the three algorithms. Accordingly, Figure 3 also shows the performance of the ensemble that
results from averaging predictions from the three methods (solid square). Corresponding statistics are presented in Table 3.
As Figure 3 shows, performance on predicting concentration of the 100% cocaine is not good, particularly for the kNN
method, as this requires significant extrapolation. Since predictions at such high concentrations are of less practical
significance than at low concentrations, Table 3 also lists statistics when the 100% cocaine sample is excluded, denoted
RMSEP* and MaxErrP*.
0.000
10.000
20.000
30.000
40.000
50.000
60.000
70.000
80.000
90.000
100.000
0
10
20
30
40
50
60
70
80
90
100
Measured Concentration (%)
Predicted Concentration (%)
Ensemble
PLS
NNet
kNN
Figure 3: Predicted versus measured concentration of cocaine using each of the three algorithms individually (hollow
symbols) and when all three are combined in an ensemble (solid square).
Combining Predictors in an Ensemble
As was explained in Sec. 3.4, an ensemble is a committee of predictors, where the opinion of each member of the ensemble
is sought when performing predictions. In this case, it is proposed to use the kNN, NN and PLS algorithms as members of
the ensemble, and to simply average the predictions from each to arrive at a final prediction. (It would be possible to use a
weighted average if independent experiments had established the relative accuracy of each, but lack of data prevents that
from being done in this case.)
As was mentioned previously, for the accuracy of an ensemble to be greater on average than that of any of its members, it is
necessary and sufficient that each member is accurate and that the predictions produced by members are diverse
17
. Figure 3
shows superimposed plots of predicted versus measured concentration of cocaine, similar to the plot of Figure 2. In Figure
3, results are shown for the partial least squares method (hollow square) and kNN algorithm (hollow triangle) as well
repeating the neural network result (hollow circle). It is clear from the plot that the three methods are better than random
and that their predictions are diverse: there is at least 15% difference in some predictions. Hence, it is reasonable to
construct an ensemble from the three algorithms. Accordingly, Figure 3 also shows the performance of the ensemble that
results from averaging predictions from the three methods (solid square). Corresponding statistics are presented in Table 3.
As Figure 3 shows, performance on predicting concentration of the 100% cocaine is not good, particularly for the kNN
method, as this requires significant extrapolation. Since predictions at such high concentrations are of less practical
significance than at low concentrations, Table 3 also lists statistics when the 100% cocaine sample is excluded, denoted
RMSEP* and MaxErrP*.
0.000
10.000
20.000
30.000
40.000
50.000
60.000
70.000
80.000
90.000
100.000
0
10
20
30
40
50
60
70
80
90
100
Measured Concentration (%)
Predicted Concentration (%)
Ensemble
PLS
NNet
kNN
Figure 3: Predicted versus measured concentration of cocaine using each of the three algorithms individually (hollow
symbols) and when all three are combined in an ensemble (solid square).