

22
A. G. RYDER
timing of fluid migration. This information is of significant importance to the petroleum
exploration industry, particularly in regard to the study of petroleum reservoirs. The
analysis of HCFI is done either by crushing bulk rock samples and extracting the
entrapped fluid for analysis, or by the analysis of single fluid inclusions. The oil
composition data obtained from bulk fluid inclusion analysis (by crushing) suffers from a
variety of problems including: sample destruction, mixing of fluids from heterogeneous
fluid inclusions, and contamination from materials within the rock sample itself.
69
Fluorescence based methods are widely used for studying HCFI and the most
common identification method is by observing their fluorescence under UV
illumination.
70, 71 The use of visually determined fluorescence colour, is widely used as a
qualitative guide for assessing the maturity of oil in HCFI.
67 Unfortunately, the use of
fluorescence colour is intrinsically prone to error, and does not yield quantitative results.
In addition, there are issues with instrumental variation (excitation wavelength, emission
filters, etc.) and reproducibility.
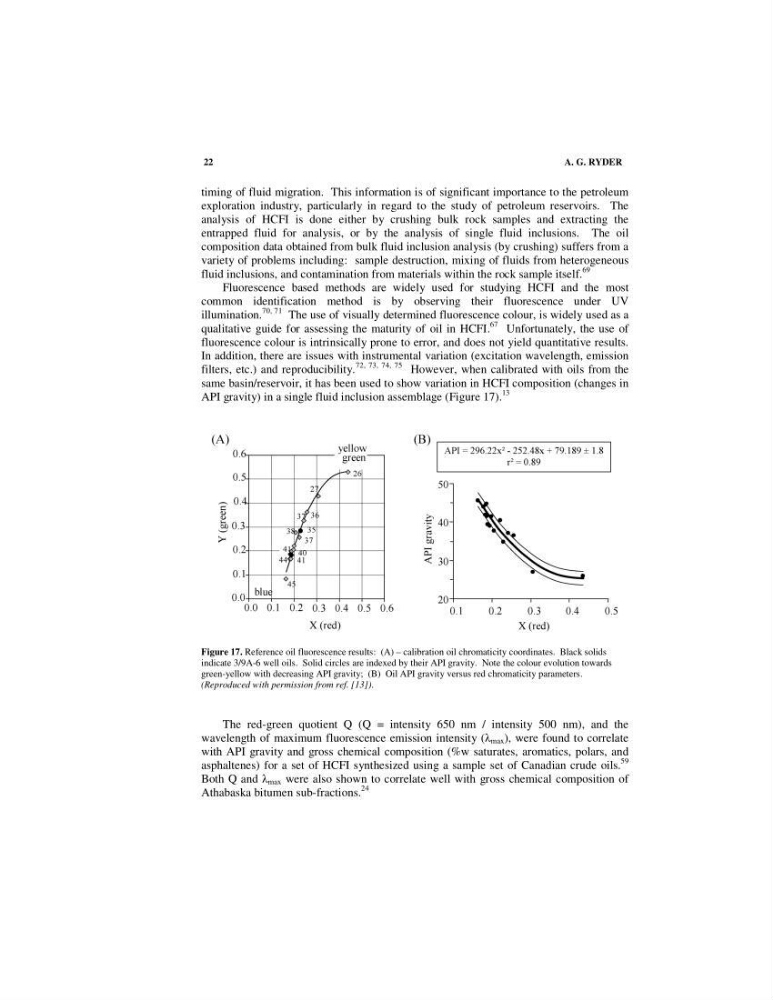
72, 73, 74, 75 However, when calibrated with oils from the
same basin/reservoir, it has been used to show variation in HCFI composition (changes in
API gravity) in a single fluid inclusion assemblage (Figure 17).
13
Figure 17. Reference oil fluorescence results: (A) – calibration oil chromaticity coordinates. Black solids
indicate 3/9A-6 well oils. Solid circles are indexed by their API gravity. Note the colour evolution towards
green-yellow with decreasing API gravity; (B) Oil API gravity versus red chromaticity parameters.
(Reproduced with permission from ref. [13]).
The red-green quotient Q (Q = intensity 650 nm / intensity 500 nm), and the
wavelength of maximum fluorescence emission intensity ( max ), were found to correlate
with API gravity and gross chemical composition (%w saturates, aromatics, polars, and
asphaltenes) for a set of HCFI synthesized using a sample set of Canadian crude oils.
59
Both Q and max were also shown to correlate well with gross chemical composition of
Athabaska bitumen sub-fractions.
24
A. G. RYDER
timing of fluid migration. This information is of significant importance to the petroleum
exploration industry, particularly in regard to the study of petroleum reservoirs. The
analysis of HCFI is done either by crushing bulk rock samples and extracting the
entrapped fluid for analysis, or by the analysis of single fluid inclusions. The oil
composition data obtained from bulk fluid inclusion analysis (by crushing) suffers from a
variety of problems including: sample destruction, mixing of fluids from heterogeneous
fluid inclusions, and contamination from materials within the rock sample itself.
69
Fluorescence based methods are widely used for studying HCFI and the most
common identification method is by observing their fluorescence under UV
illumination.
70, 71 The use of visually determined fluorescence colour, is widely used as a
qualitative guide for assessing the maturity of oil in HCFI.
67 Unfortunately, the use of
fluorescence colour is intrinsically prone to error, and does not yield quantitative results.
In addition, there are issues with instrumental variation (excitation wavelength, emission
filters, etc.) and reproducibility.
72, 73, 74, 75 However, when calibrated with oils from the
same basin/reservoir, it has been used to show variation in HCFI composition (changes in
API gravity) in a single fluid inclusion assemblage (Figure 17).
13
Figure 17. Reference oil fluorescence results: (A) – calibration oil chromaticity coordinates. Black solids
indicate 3/9A-6 well oils. Solid circles are indexed by their API gravity. Note the colour evolution towards
green-yellow with decreasing API gravity; (B) Oil API gravity versus red chromaticity parameters.
(Reproduced with permission from ref. [13]).
The red-green quotient Q (Q = intensity 650 nm / intensity 500 nm), and the
wavelength of maximum fluorescence emission intensity ( max ), were found to correlate
with API gravity and gross chemical composition (%w saturates, aromatics, polars, and
asphaltenes) for a set of HCFI synthesized using a sample set of Canadian crude oils.
59
Both Q and max were also shown to correlate well with gross chemical composition of
Athabaska bitumen sub-fractions.
24