

18
A. G. RYDER
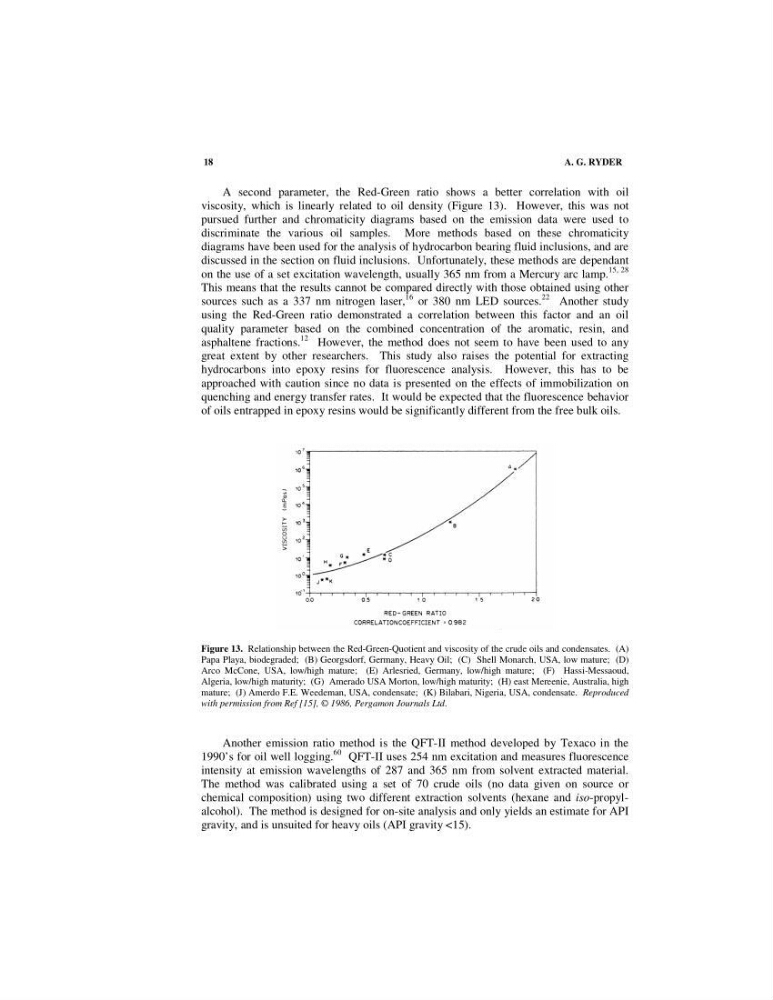
A second parameter, the Red-Green ratio shows a better correlation with oil
viscosity, which is linearly related to oil density (Figure 13). However, this was not
pursued further and chromaticity diagrams based on the emission data were used to
discriminate the various oil samples. More methods based on these chromaticity
diagrams have been used for the analysis of hydrocarbon bearing fluid inclusions, and are
discussed in the section on fluid inclusions. Unfortunately, these methods are dependant
on the use of a set excitation wavelength, usually 365 nm from a Mercury arc lamp.
15, 28
This means that the results cannot be compared directly with those obtained using other
sources such as a 337 nm nitrogen laser,
16 or 380 nm LED sources.
22 Another study
using the Red-Green ratio demonstrated a correlation between this factor and an oil
quality parameter based on the combined concentration of the aromatic, resin, and
asphaltene fractions.
12 However, the method does not seem to have been used to any
great extent by other researchers. This study also raises the potential for extracting
hydrocarbons into epoxy resins for fluorescence analysis. However, this has to be
approached with caution since no data is presented on the effects of immobilization on
quenching and energy transfer rates. It would be expected that the fluorescence behavior
of oils entrapped in epoxy resins would be significantly different from the free bulk oils.
Figure 13. Relationship between the Red-Green-Quotient and viscosity of the crude oils and condensates. (A)
Papa Playa, biodegraded; (B) Georgsdorf, Germany, Heavy Oil; (C) Shell Monarch, USA, low mature; (D)
Arco McCone, USA, low/high mature; (E) Arlesried, Germany, low/high mature; (F) Hassi-Messaoud,
Algeria, low/high maturity; (G) Amerado USA Morton, low/high maturity; (H) east Mereenie, Australia, high
mature; (J) Amerdo F.E. Weedeman, USA, condensate; (K) Bilabari, Nigeria, USA, condensate. Reproduced
with permission from Ref [15], © 1986, Pergamon Journals Ltd.
Another emission ratio method is the QFT-II method developed by Texaco in the
1990’s for oil well logging.
60 QFT-II uses 254 nm excitation and measures fluorescence
intensity at emission wavelengths of 287 and 365 nm from solvent extracted material.
The method was calibrated using a set of 70 crude oils (no data given on source or
chemical composition) using two different extraction solvents (hexane and iso-propylalcohol). The method is designed for on-site analysis and only yields an estimate for API
gravity, and is unsuited for heavy oils (API gravity <15).
A. G. RYDER
A second parameter, the Red-Green ratio shows a better correlation with oil
viscosity, which is linearly related to oil density (Figure 13). However, this was not
pursued further and chromaticity diagrams based on the emission data were used to
discriminate the various oil samples. More methods based on these chromaticity
diagrams have been used for the analysis of hydrocarbon bearing fluid inclusions, and are
discussed in the section on fluid inclusions. Unfortunately, these methods are dependant
on the use of a set excitation wavelength, usually 365 nm from a Mercury arc lamp.
15, 28
This means that the results cannot be compared directly with those obtained using other
sources such as a 337 nm nitrogen laser,
16 or 380 nm LED sources.
22 Another study
using the Red-Green ratio demonstrated a correlation between this factor and an oil
quality parameter based on the combined concentration of the aromatic, resin, and
asphaltene fractions.
12 However, the method does not seem to have been used to any
great extent by other researchers. This study also raises the potential for extracting
hydrocarbons into epoxy resins for fluorescence analysis. However, this has to be
approached with caution since no data is presented on the effects of immobilization on
quenching and energy transfer rates. It would be expected that the fluorescence behavior
of oils entrapped in epoxy resins would be significantly different from the free bulk oils.
Figure 13. Relationship between the Red-Green-Quotient and viscosity of the crude oils and condensates. (A)
Papa Playa, biodegraded; (B) Georgsdorf, Germany, Heavy Oil; (C) Shell Monarch, USA, low mature; (D)
Arco McCone, USA, low/high mature; (E) Arlesried, Germany, low/high mature; (F) Hassi-Messaoud,
Algeria, low/high maturity; (G) Amerado USA Morton, low/high maturity; (H) east Mereenie, Australia, high
mature; (J) Amerdo F.E. Weedeman, USA, condensate; (K) Bilabari, Nigeria, USA, condensate. Reproduced
with permission from Ref [15], © 1986, Pergamon Journals Ltd.
Another emission ratio method is the QFT-II method developed by Texaco in the
1990’s for oil well logging.
60 QFT-II uses 254 nm excitation and measures fluorescence
intensity at emission wavelengths of 287 and 365 nm from solvent extracted material.
The method was calibrated using a set of 70 crude oils (no data given on source or
chemical composition) using two different extraction solvents (hexane and iso-propylalcohol). The method is designed for on-site analysis and only yields an estimate for API
gravity, and is unsuited for heavy oils (API gravity <15).