

ANALYSIS OF OILS USING FLUORESCENCE.
17
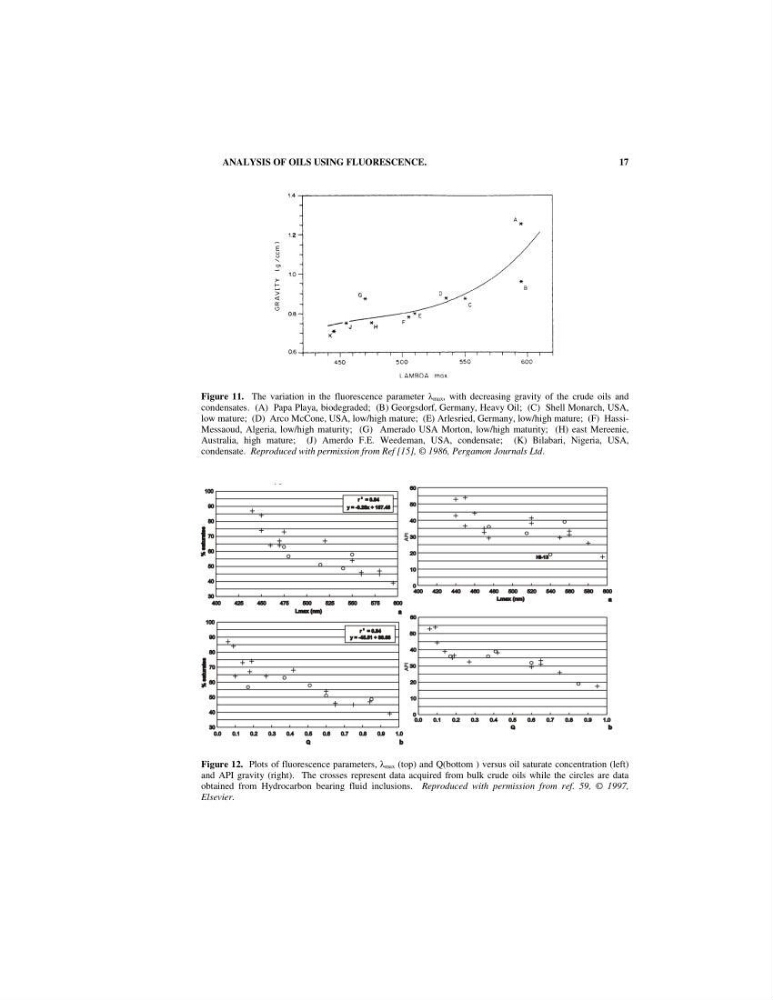
Figure 11. The variation in the fluorescence parameter max, with decreasing gravity of the crude oils and
condensates. (A) Papa Playa, biodegraded; (B) Georgsdorf, Germany, Heavy Oil; (C) Shell Monarch, USA,
low mature; (D) Arco McCone, USA, low/high mature; (E) Arlesried, Germany, low/high mature; (F) HassiMessaoud, Algeria, low/high maturity; (G) Amerado USA Morton, low/high maturity; (H) east Mereenie,
Australia, high mature; (J) Amerdo F.E. Weedeman, USA, condensate; (K) Bilabari, Nigeria, USA,
condensate. Reproduced with permission from Ref [15], © 1986, Pergamon Journals Ltd.
Figure 12. Plots of fluorescence parameters, max (top) and Q(bottom ) versus oil saturate concentration (left)
and API gravity (right). The crosses represent data acquired from bulk crude oils while the circles are data
obtained from Hydrocarbon bearing fluid inclusions. Reproduced with permission from ref. 59, © 1997,
Elsevier.
17
Figure 11. The variation in the fluorescence parameter max, with decreasing gravity of the crude oils and
condensates. (A) Papa Playa, biodegraded; (B) Georgsdorf, Germany, Heavy Oil; (C) Shell Monarch, USA,
low mature; (D) Arco McCone, USA, low/high mature; (E) Arlesried, Germany, low/high mature; (F) HassiMessaoud, Algeria, low/high maturity; (G) Amerado USA Morton, low/high maturity; (H) east Mereenie,
Australia, high mature; (J) Amerdo F.E. Weedeman, USA, condensate; (K) Bilabari, Nigeria, USA,
condensate. Reproduced with permission from Ref [15], © 1986, Pergamon Journals Ltd.
Figure 12. Plots of fluorescence parameters, max (top) and Q(bottom ) versus oil saturate concentration (left)
and API gravity (right). The crosses represent data acquired from bulk crude oils while the circles are data
obtained from Hydrocarbon bearing fluid inclusions. Reproduced with permission from ref. 59, © 1997,
Elsevier.