

support and thus the scientists are obliged to use only
freely available data.
Applying the methodology of meta-analysis we have
found that there has been a strong upward trend in the
study of the phenomenon of coastal erosion in the last
twenty years and there are three interesting periods which
seems to be equally distributed at a rate of 35%: a) below
the 10 years, b) 10 to 30 years and c) 30 to 70 years, while
for a period of more than 70 years there seems to be little
interest since it is quite difficult to retrieve the necessary
historical data. Furthermore, the usage of Landsat satellite
images dominates among researchers at a rate of up to
40% while high-resolution data such as IKONOS,
Worldview1-2, QuickBird, Pleiades, etc., data seems to
lag far behind at less than 5%. This high range is as
Landsat images are freely available and very useful to
diachronic studies. The usage of medium spatial resolution data such as SPOT (1/2/3/4) and Sentinel ranges
from 5% to 7% in general. The UAV imagery is noticeable
at a rate of 8% and seems that it will be used widely in the
future as it is adopted by the researchers from 2015
onwards. Regarding the favorite software in the studies,
ArcMap is being used at a rate of 38% of them, while a
sum of the studies that have used software without reference to its type or name and software that has been used
occasionally one to three times are at a rate of 35%.
ArcMap software has those great rates mainly because
of the DSAS add-on tool which is very common among
researchers. Moreover, the NWDI indicator has been
used by most of researchers to delineate land from
water at a rate of 37,21%. In addition, we classified the
shoreline extraction methods in two main categories a)
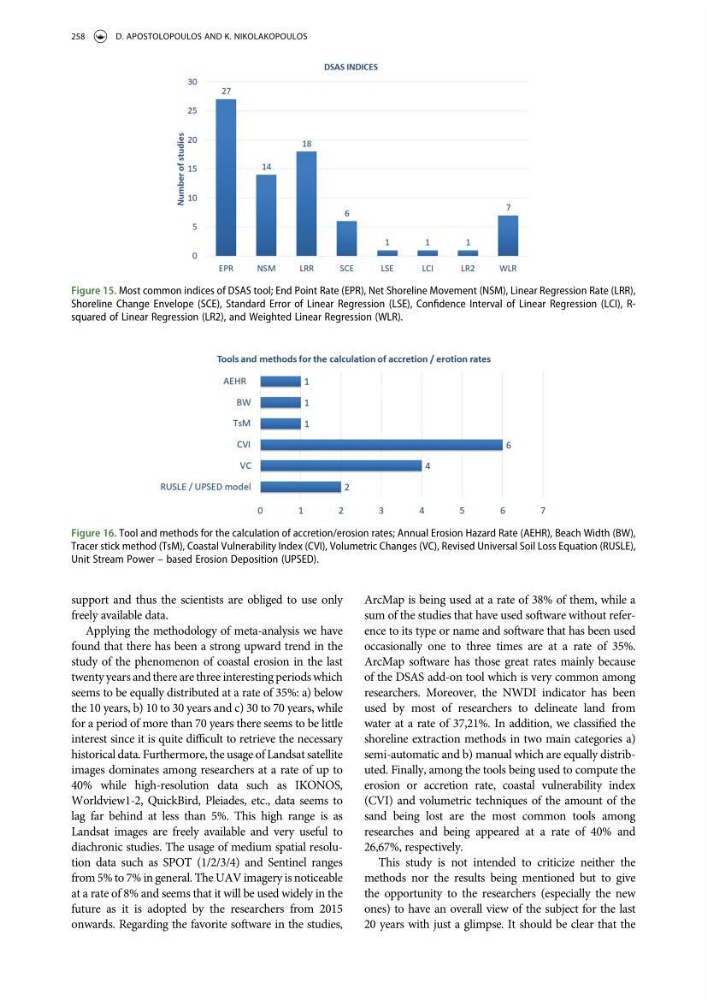
semi-automatic and b) manual which are equally distributed. Finally, among the tools being used to compute the
erosion or accretion rate, coastal vulnerability index
(CVI) and volumetric techniques of the amount of the
sand being lost are the most common tools among
researches and being appeared at a rate of 40% and
26,67%, respectively.
This study is not intended to criticize neither the
methods nor the results being mentioned but to give
the opportunity to the researchers (especially the new
ones) to have an overall view of the subject for the last
20 years with just a glimpse. It should be clear that the
Figure 16. Tool and methods for the calculation of accretion/erosion rates; Annual Erosion Hazard Rate (AEHR), Beach Width (BW),
Tracer stick method (TsM), Coastal Vulnerability Index (CVI), Volumetric Changes (VC), Revised Universal Soil Loss Equation (RUSLE),
Unit Stream Power – based Erosion Deposition (UPSED).
Figure 15. Most common indices of DSAS tool; End Point Rate (EPR), Net Shoreline Movement (NSM), Linear Regression Rate (LRR),
Shoreline Change Envelope (SCE), Standard Error of Linear Regression (LSE), Confidence Interval of Linear Regression (LCI), Rsquared of Linear Regression (LR2), and Weighted Linear Regression (WLR).
258
D. APOSTOLOPOULOS AND K. NIKOLAKOPOULOS
freely available data.
Applying the methodology of meta-analysis we have
found that there has been a strong upward trend in the
study of the phenomenon of coastal erosion in the last
twenty years and there are three interesting periods which
seems to be equally distributed at a rate of 35%: a) below
the 10 years, b) 10 to 30 years and c) 30 to 70 years, while
for a period of more than 70 years there seems to be little
interest since it is quite difficult to retrieve the necessary
historical data. Furthermore, the usage of Landsat satellite
images dominates among researchers at a rate of up to
40% while high-resolution data such as IKONOS,
Worldview1-2, QuickBird, Pleiades, etc., data seems to
lag far behind at less than 5%. This high range is as
Landsat images are freely available and very useful to
diachronic studies. The usage of medium spatial resolution data such as SPOT (1/2/3/4) and Sentinel ranges
from 5% to 7% in general. The UAV imagery is noticeable
at a rate of 8% and seems that it will be used widely in the
future as it is adopted by the researchers from 2015
onwards. Regarding the favorite software in the studies,
ArcMap is being used at a rate of 38% of them, while a
sum of the studies that have used software without reference to its type or name and software that has been used
occasionally one to three times are at a rate of 35%.
ArcMap software has those great rates mainly because
of the DSAS add-on tool which is very common among
researchers. Moreover, the NWDI indicator has been
used by most of researchers to delineate land from
water at a rate of 37,21%. In addition, we classified the
shoreline extraction methods in two main categories a)
semi-automatic and b) manual which are equally distributed. Finally, among the tools being used to compute the
erosion or accretion rate, coastal vulnerability index
(CVI) and volumetric techniques of the amount of the
sand being lost are the most common tools among
researches and being appeared at a rate of 40% and
26,67%, respectively.
This study is not intended to criticize neither the
methods nor the results being mentioned but to give
the opportunity to the researchers (especially the new
ones) to have an overall view of the subject for the last
20 years with just a glimpse. It should be clear that the
Figure 16. Tool and methods for the calculation of accretion/erosion rates; Annual Erosion Hazard Rate (AEHR), Beach Width (BW),
Tracer stick method (TsM), Coastal Vulnerability Index (CVI), Volumetric Changes (VC), Revised Universal Soil Loss Equation (RUSLE),
Unit Stream Power – based Erosion Deposition (UPSED).
Figure 15. Most common indices of DSAS tool; End Point Rate (EPR), Net Shoreline Movement (NSM), Linear Regression Rate (LRR),
Shoreline Change Envelope (SCE), Standard Error of Linear Regression (LSE), Confidence Interval of Linear Regression (LCI), Rsquared of Linear Regression (LR2), and Weighted Linear Regression (WLR).
258
D. APOSTOLOPOULOS AND K. NIKOLAKOPOULOS