

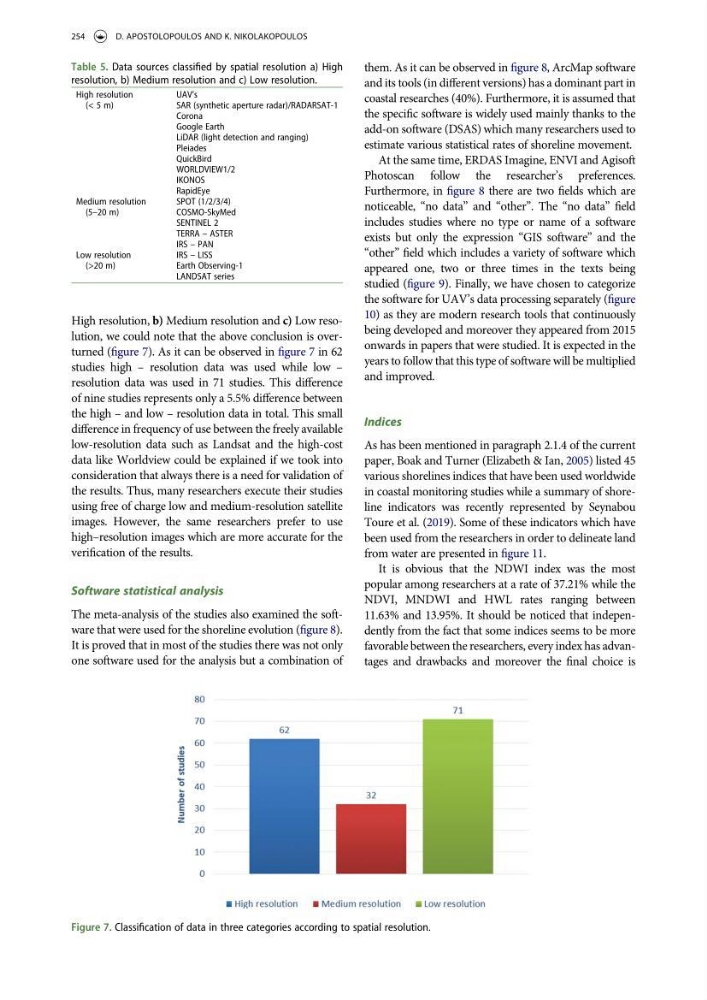
High resolution, b) Medium resolution and c) Low resolution, we could note that the above conclusion is overturned (figure 7). As it can be observed in figure 7 in 62
studies high – resolution data was used while low –
resolution data was used in 71 studies. This difference
of nine studies represents only a 5.5% difference between
the high – and low – resolution data in total. This small
difference in frequency of use between the freely available
low-resolution data such as Landsat and the high-cost
data like Worldview could be explained if we took into
consideration that always there is a need for validation of
the results. Thus, many researchers execute their studies
using free of charge low and medium-resolution satellite
images. However, the same researchers prefer to use
high–resolution images which are more accurate for the
verification of the results.
Software statistical analysis
The meta-analysis of the studies also examined the software that were used for the shoreline evolution (figure 8).
It is proved that in most of the studies there was not only
one software used for the analysis but a combination of
them. As it can be observed in figure 8, ArcMap software
and its tools (in different versions) has a dominant part in
coastal researches (40%). Furthermore, it is assumed that
the specific software is widely used mainly thanks to the
add-on software (DSAS) which many researchers used to
estimate various statistical rates of shoreline movement.
At the same time, ERDAS Imagine, ENVI and Agisoft
Photoscan follow the researcher’s preferences.
Furthermore, in figure 8 there are two fields which are
noticeable, “no data” and “other”. The “no data” field
includes studies where no type or name of a software
exists but only the expression “GIS software” and the
“other” field which includes a variety of software which
appeared one, two or three times in the texts being
studied (figure 9). Finally, we have chosen to categorize
the software for UAV’s data processing separately (figure
10) as they are modern research tools that continuously
being developed and moreover they appeared from 2015
onwards in papers that were studied. It is expected in the
years to follow that this type of software will be multiplied
and improved.
Indices
As has been mentioned in paragraph 2.1.4 of the current
paper, Boak and Turner (Elizabeth & Ian, 2005) listed 45
various shorelines indices that have been used worldwide
in coastal monitoring studies while a summary of shoreline indicators was recently represented by Seynabou
Toure et al. (2019). Some of these indicators which have
been used from the researchers in order to delineate land
from water are presented in figure 11.
It is obvious that the NDWI index was the most
popular among researchers at a rate of 37.21% while the
NDVI, MNDWI and HWL rates ranging between
11.63% and 13.95%. It should be noticed that independently from the fact that some indices seems to be more
favorable between the researchers, every index has advantages and drawbacks and moreover the final choice is
Table 5. Data sources classified by spatial resolution a) High
resolution, b) Medium resolution and c) Low resolution.
High resolution
(< 5 m)
UAV’s
SAR (synthetic aperture radar)/RADARSAT-1
Corona
Google Earth
LiDAR (light detection and ranging)
Pleiades
QuickBird
WORLDVIEW1/2
IKONOS
RapidEye
Medium resolution
(5–20 m)
SPOT (1/2/3/4)
COSMO-SkyMed
SENTINEL 2
TERRA – ASTER
IRS – PAN
Low resolution
(>20 m)
IRS – LISS
Earth Observing-1
LANDSAT series
Figure 7. Classification of data in three categories according to spatial resolution.
254
D. APOSTOLOPOULOS AND K. NIKOLAKOPOULOS
studies high – resolution data was used while low –
resolution data was used in 71 studies. This difference
of nine studies represents only a 5.5% difference between
the high – and low – resolution data in total. This small
difference in frequency of use between the freely available
low-resolution data such as Landsat and the high-cost
data like Worldview could be explained if we took into
consideration that always there is a need for validation of
the results. Thus, many researchers execute their studies
using free of charge low and medium-resolution satellite
images. However, the same researchers prefer to use
high–resolution images which are more accurate for the
verification of the results.
Software statistical analysis
The meta-analysis of the studies also examined the software that were used for the shoreline evolution (figure 8).
It is proved that in most of the studies there was not only
one software used for the analysis but a combination of
them. As it can be observed in figure 8, ArcMap software
and its tools (in different versions) has a dominant part in
coastal researches (40%). Furthermore, it is assumed that
the specific software is widely used mainly thanks to the
add-on software (DSAS) which many researchers used to
estimate various statistical rates of shoreline movement.
At the same time, ERDAS Imagine, ENVI and Agisoft
Photoscan follow the researcher’s preferences.
Furthermore, in figure 8 there are two fields which are
noticeable, “no data” and “other”. The “no data” field
includes studies where no type or name of a software
exists but only the expression “GIS software” and the
“other” field which includes a variety of software which
appeared one, two or three times in the texts being
studied (figure 9). Finally, we have chosen to categorize
the software for UAV’s data processing separately (figure
10) as they are modern research tools that continuously
being developed and moreover they appeared from 2015
onwards in papers that were studied. It is expected in the
years to follow that this type of software will be multiplied
and improved.
Indices
As has been mentioned in paragraph 2.1.4 of the current
paper, Boak and Turner (Elizabeth & Ian, 2005) listed 45
various shorelines indices that have been used worldwide
in coastal monitoring studies while a summary of shoreline indicators was recently represented by Seynabou
Toure et al. (2019). Some of these indicators which have
been used from the researchers in order to delineate land
from water are presented in figure 11.
It is obvious that the NDWI index was the most
popular among researchers at a rate of 37.21% while the
NDVI, MNDWI and HWL rates ranging between
11.63% and 13.95%. It should be noticed that independently from the fact that some indices seems to be more
favorable between the researchers, every index has advantages and drawbacks and moreover the final choice is
Table 5. Data sources classified by spatial resolution a) High
resolution, b) Medium resolution and c) Low resolution.
High resolution
(< 5 m)
UAV’s
SAR (synthetic aperture radar)/RADARSAT-1
Corona
Google Earth
LiDAR (light detection and ranging)
Pleiades
QuickBird
WORLDVIEW1/2
IKONOS
RapidEye
Medium resolution
(5–20 m)
SPOT (1/2/3/4)
COSMO-SkyMed
SENTINEL 2
TERRA – ASTER
IRS – PAN
Low resolution
(>20 m)
IRS – LISS
Earth Observing-1
LANDSAT series
Figure 7. Classification of data in three categories according to spatial resolution.
254
D. APOSTOLOPOULOS AND K. NIKOLAKOPOULOS