

period we can assume that that is happed probably due
to the fact that new and accurate data of these years are
available as mentioned before. Moreover, the (c) period (30 < n ≤ 70) seems to be in great interest probably
due to the fact that many researchers have tried to
combine many types of available data due to the time.
Furthermore, the (b) period (10 < n ≤ 30) is in great
demand as it represents a sort-term period which is
most peoples’ concern.
Finally, the (d) period should include historical
data, i.e. old maps and aerial photos which are in low
accuracy and their scope is most for the study of the
diachronic evolution of an area.
Materials
Through literature we found and recorded many types
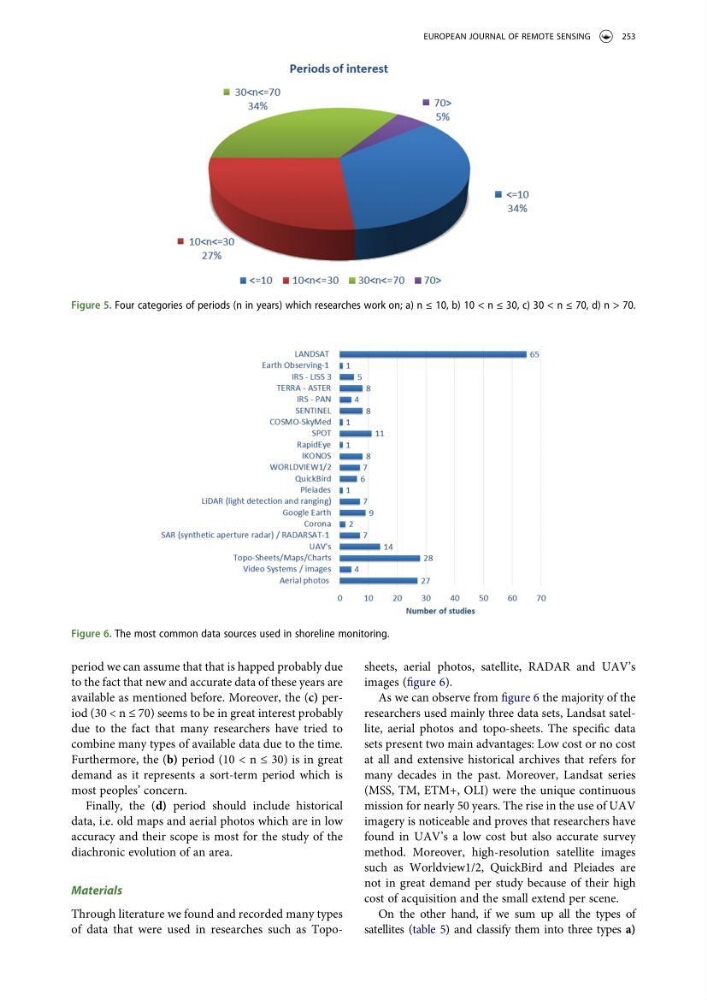
of data that were used in researches such as Toposheets, aerial photos, satellite, RADAR and UAV’s
images (figure 6).
As we can observe from figure 6 the majority of the
researchers used mainly three data sets, Landsat satellite, aerial photos and topo-sheets. The specific data
sets present two main advantages: Low cost or no cost
at all and extensive historical archives that refers for
many decades in the past. Moreover, Landsat series
(MSS, TM, ETM+, OLI) were the unique continuous
mission for nearly 50 years. The rise in the use of UAV
imagery is noticeable and proves that researchers have
found in UAV’s a low cost but also accurate survey
method. Moreover, high-resolution satellite images
such as Worldview1/2, QuickBird and Pleiades are
not in great demand per study because of their high
cost of acquisition and the small extend per scene.
On the other hand, if we sum up all the types of
satellites (table 5) and classify them into three types a)
Figure 6. The most common data sources used in shoreline monitoring.
Figure 5. Four categories of periods (n in years) which researches work on; a) n ≤ 10, b) 10 < n ≤ 30, c) 30 < n ≤ 70, d) n > 70.
EUROPEAN JOURNAL OF REMOTE SENSING
253
to the fact that new and accurate data of these years are
available as mentioned before. Moreover, the (c) period (30 < n ≤ 70) seems to be in great interest probably
due to the fact that many researchers have tried to
combine many types of available data due to the time.
Furthermore, the (b) period (10 < n ≤ 30) is in great
demand as it represents a sort-term period which is
most peoples’ concern.
Finally, the (d) period should include historical
data, i.e. old maps and aerial photos which are in low
accuracy and their scope is most for the study of the
diachronic evolution of an area.
Materials
Through literature we found and recorded many types
of data that were used in researches such as Toposheets, aerial photos, satellite, RADAR and UAV’s
images (figure 6).
As we can observe from figure 6 the majority of the
researchers used mainly three data sets, Landsat satellite, aerial photos and topo-sheets. The specific data
sets present two main advantages: Low cost or no cost
at all and extensive historical archives that refers for
many decades in the past. Moreover, Landsat series
(MSS, TM, ETM+, OLI) were the unique continuous
mission for nearly 50 years. The rise in the use of UAV
imagery is noticeable and proves that researchers have
found in UAV’s a low cost but also accurate survey
method. Moreover, high-resolution satellite images
such as Worldview1/2, QuickBird and Pleiades are
not in great demand per study because of their high
cost of acquisition and the small extend per scene.
On the other hand, if we sum up all the types of
satellites (table 5) and classify them into three types a)
Figure 6. The most common data sources used in shoreline monitoring.
Figure 5. Four categories of periods (n in years) which researches work on; a) n ≤ 10, b) 10 < n ≤ 30, c) 30 < n ≤ 70, d) n > 70.
EUROPEAN JOURNAL OF REMOTE SENSING
253