

346
CHAPTER 7. LABORATORY WAVE GENERATION
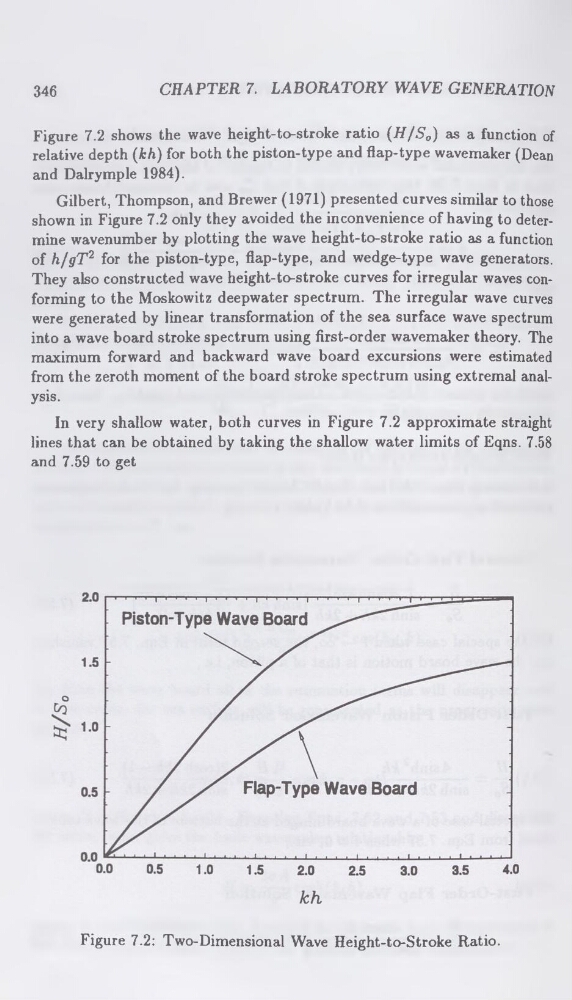
Figure 7.2 shows the wave height-to-stroke ratio (H/So) as a function of
relative depth (kh) for both the piston-type and flap-type wavemaker (Dean
and Dalrymple 1984).
Gilbert, Thompson, and Brewer (1971) presented curves similar to those
shown in Figure 7.2 only they avoided the inconvenience of having to determine wavenumber by plotting the wave height-to-stroke ratio as a function
of h/gT2 for the piston-type, flap-type, and wedge-type wave generators.
They also constructed wave height-to-stroke curves for irregular waves conforming to the Moskowitz deepwater spectrum. The irregular wave curves
were generated by linear transformation of the sea surface wave spectrum
into a wave board stroke spectrum using first-order wavemaker theory. The
maximum forward and backward wave board excursions were estimated
from the zeroth moment of the board stroke spectrum using extremal analysis.
In very shallow water, both curves in Figure 7.2 approximate straight
lines that can be obtained by taking the shallow water limits of Eqns. 7.58
and 7.59 to get
Figure 7.2: Two-Dimensional Wave Height-to-Stroke Ratio.
CHAPTER 7. LABORATORY WAVE GENERATION
Figure 7.2 shows the wave height-to-stroke ratio (H/So) as a function of
relative depth (kh) for both the piston-type and flap-type wavemaker (Dean
and Dalrymple 1984).
Gilbert, Thompson, and Brewer (1971) presented curves similar to those
shown in Figure 7.2 only they avoided the inconvenience of having to determine wavenumber by plotting the wave height-to-stroke ratio as a function
of h/gT2 for the piston-type, flap-type, and wedge-type wave generators.
They also constructed wave height-to-stroke curves for irregular waves conforming to the Moskowitz deepwater spectrum. The irregular wave curves
were generated by linear transformation of the sea surface wave spectrum
into a wave board stroke spectrum using first-order wavemaker theory. The
maximum forward and backward wave board excursions were estimated
from the zeroth moment of the board stroke spectrum using extremal analysis.
In very shallow water, both curves in Figure 7.2 approximate straight
lines that can be obtained by taking the shallow water limits of Eqns. 7.58
and 7.59 to get
Figure 7.2: Two-Dimensional Wave Height-to-Stroke Ratio.