

3. Sédiment Transport
75
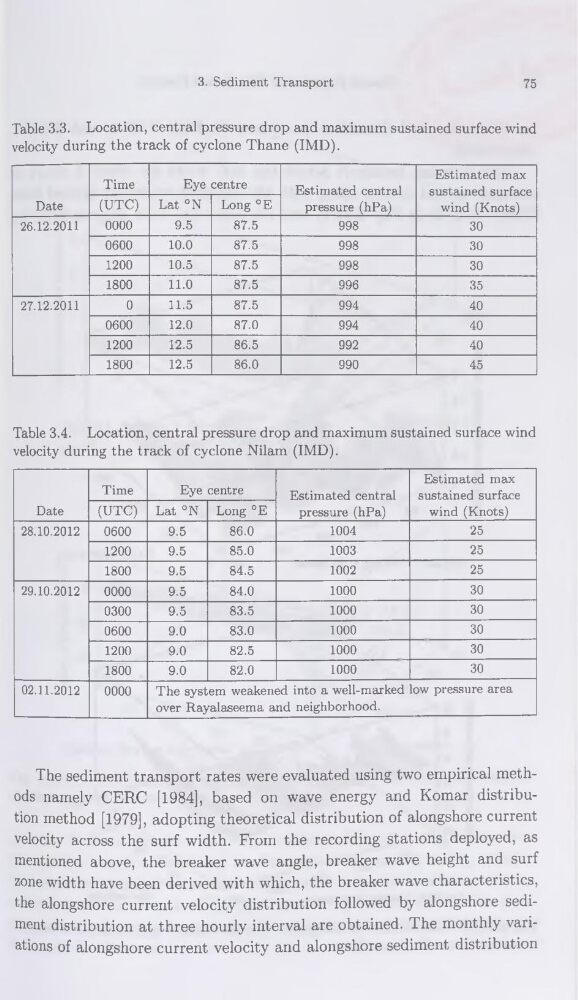
Table 3.3. Location, central pressure drop and maximum sustained surface wind
velocity during the track of cyclone Thane (IMD).
Date
Time
Eye centre
Estimated central
pressure (hPa)
Estimated max
sustained surface
wind (Knots)
(UTC) Lat °N Long °E
26.12.2011
0000
9.5
87.5
998
30
0600
10.0
87.5
998
30
1200
10.5
87.5
998
30
1800
11.0
87.5
996
35
27.12.2011
0
11.5
87.5
994
40
0600
12.0
87.0
994
40
1200
12.5
86.5
992
40
1800
12.5
86.0
990
45
Table 3.4. Location, central pressure drop and maximum sustained surface wind
velocity during the track of cyclone Nilam (IMD).
Date
Time
Eye centre
Estimated central
pressure (hPa)
Estimated max
sustained surface
wind (Knots)
(UTC) Lat °N Long °E
28.10.2012
0600
9.5
86.0
1004
25
1200
9.5
85.0
1003
25
1800
9.5
84.5
1002
25
29.10.2012
0000
9.5
84.0
1000
30
0300
9.5
83.5
1000
30
0600
9.0
83.0
1000
30
1200
9.0
82.5
1000
30
1800
9.0
82.0
1000
30
02.11.2012
0000
The System weakened into a well-marked low pressure area
over Rayalaseema and neighborhood.
The sédiment transport rates were evaluated using two empirical methods namely CERC [1984], based on wave energy and Komar distribution method [1979], adopting theoretical distribution of alongshore current
velocity across the surf width. From the recording stations deployed, as
mentioned above, the breaker wave angle, breaker wave height and surf
zone width hâve been derived with which, the breaker wave characteristics,
the alongshore current velocity distribution followed by alongshore sédiment distribution at three hourly interval are obtained. The monthly variations of alongshore current velocity and alongshore sédiment distribution
75
Table 3.3. Location, central pressure drop and maximum sustained surface wind
velocity during the track of cyclone Thane (IMD).
Date
Time
Eye centre
Estimated central
pressure (hPa)
Estimated max
sustained surface
wind (Knots)
(UTC) Lat °N Long °E
26.12.2011
0000
9.5
87.5
998
30
0600
10.0
87.5
998
30
1200
10.5
87.5
998
30
1800
11.0
87.5
996
35
27.12.2011
0
11.5
87.5
994
40
0600
12.0
87.0
994
40
1200
12.5
86.5
992
40
1800
12.5
86.0
990
45
Table 3.4. Location, central pressure drop and maximum sustained surface wind
velocity during the track of cyclone Nilam (IMD).
Date
Time
Eye centre
Estimated central
pressure (hPa)
Estimated max
sustained surface
wind (Knots)
(UTC) Lat °N Long °E
28.10.2012
0600
9.5
86.0
1004
25
1200
9.5
85.0
1003
25
1800
9.5
84.5
1002
25
29.10.2012
0000
9.5
84.0
1000
30
0300
9.5
83.5
1000
30
0600
9.0
83.0
1000
30
1200
9.0
82.5
1000
30
1800
9.0
82.0
1000
30
02.11.2012
0000
The System weakened into a well-marked low pressure area
over Rayalaseema and neighborhood.
The sédiment transport rates were evaluated using two empirical methods namely CERC [1984], based on wave energy and Komar distribution method [1979], adopting theoretical distribution of alongshore current
velocity across the surf width. From the recording stations deployed, as
mentioned above, the breaker wave angle, breaker wave height and surf
zone width hâve been derived with which, the breaker wave characteristics,
the alongshore current velocity distribution followed by alongshore sédiment distribution at three hourly interval are obtained. The monthly variations of alongshore current velocity and alongshore sédiment distribution