

70
Coastal Engineering: Theory and Practice
resuit in the loss of information in capturing high frequency waves. A wave
rider buoy on the other hand floats on the surface. The buoy heave motion
provides the surface élévation and the directionality can be derived from its
roll and pitch. Hence it has been deployed in a water depth of 20 m. A view
of the instruments that were deployed in Océan for the acquisition of field
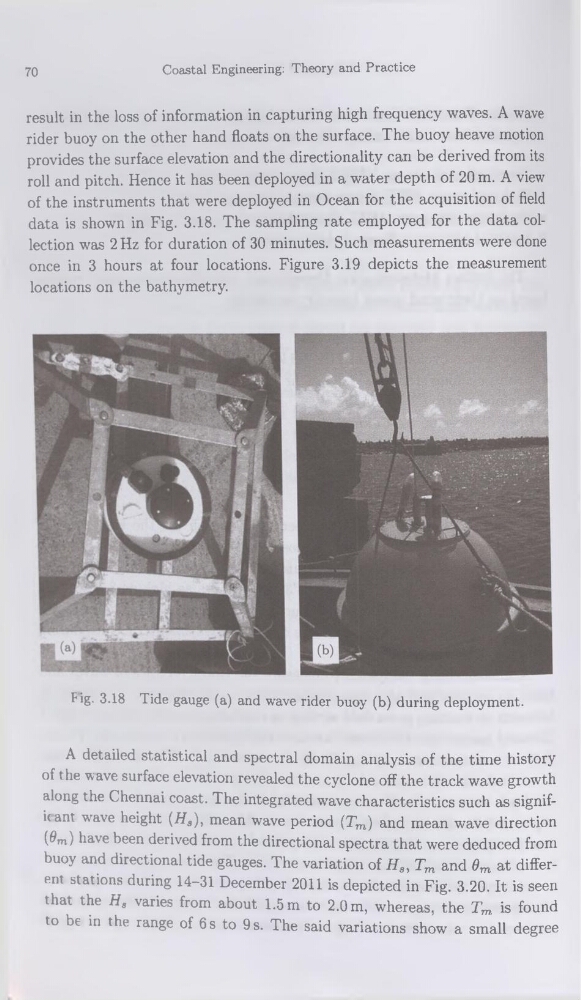
data is shown in Fig. 3.18. The sampling rate employed for the data collection was 2 Hz for duration of 30 minutes. Such measurements were done
once in 3 hours at four locations. Figure 3.19 depicts the measurement
locations on the bathymetry.
lig. 3.18 Tide gauge (a) and wave rider buoy (b) during deployment.
A detailed statistical and spectral domain analysis of the time history
of the wave surface élévation revealed the cyclone off the track wave growth
along the Chennai coast. The integrated wave characteristics such as signifie ant wave height (Ha), mean wave period (Tm) and mean wave direction
(0m) hâve been derived from the directional spectra that were deduced from
buoy and directional tide gauges. The variation of Ha, Tm and 0m at different stations during 14-31 December 2011 is depicted in Fig. 3.20. It is seen
that the Hs varies from about 1.5 m to 2.0 m, whereas, the Tm is found
to be in the range of 6s to 9 s. The said variations show a small degree
Coastal Engineering: Theory and Practice
resuit in the loss of information in capturing high frequency waves. A wave
rider buoy on the other hand floats on the surface. The buoy heave motion
provides the surface élévation and the directionality can be derived from its
roll and pitch. Hence it has been deployed in a water depth of 20 m. A view
of the instruments that were deployed in Océan for the acquisition of field
data is shown in Fig. 3.18. The sampling rate employed for the data collection was 2 Hz for duration of 30 minutes. Such measurements were done
once in 3 hours at four locations. Figure 3.19 depicts the measurement
locations on the bathymetry.
lig. 3.18 Tide gauge (a) and wave rider buoy (b) during deployment.
A detailed statistical and spectral domain analysis of the time history
of the wave surface élévation revealed the cyclone off the track wave growth
along the Chennai coast. The integrated wave characteristics such as signifie ant wave height (Ha), mean wave period (Tm) and mean wave direction
(0m) hâve been derived from the directional spectra that were deduced from
buoy and directional tide gauges. The variation of Ha, Tm and 0m at different stations during 14-31 December 2011 is depicted in Fig. 3.20. It is seen
that the Hs varies from about 1.5 m to 2.0 m, whereas, the Tm is found
to be in the range of 6s to 9 s. The said variations show a small degree