

2. Characteristics and Motion of Sédiments
25
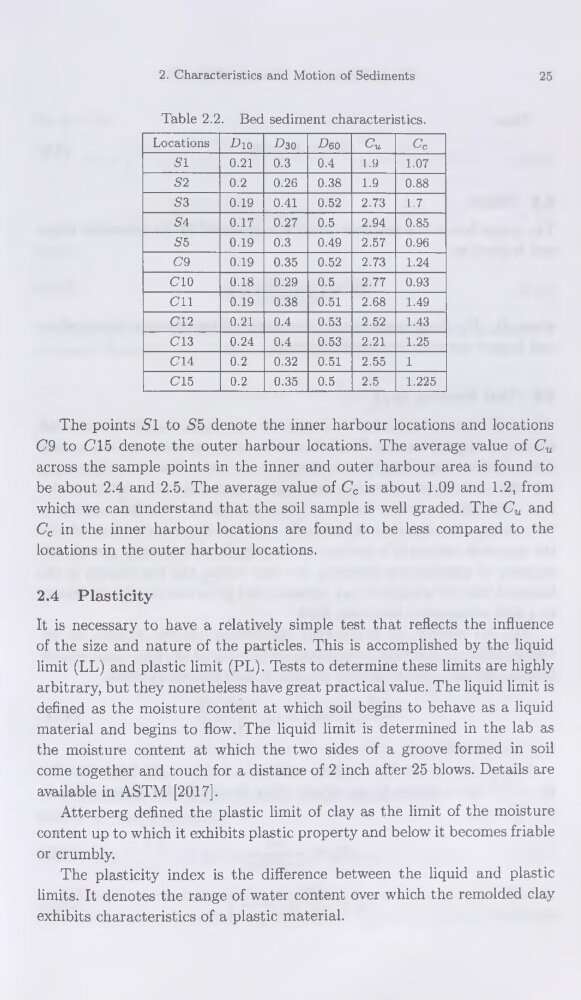
Table 2.2. Bed sédiment characteristics.
Locations jDio
D30
Ceo
Cu
Cc
SI
0.21
0.3
0.4
1.9
1.07
S2
0.2
0.26 0.38
1.9
0.88
S3
0.19 0.41
0.52 2.73
1.7
S4
0.17 0.27 0.5
2.94 0.85
S5
0.19 0.3
0.49 2.57 0.96
C9
0.19 0.35 0.52
2.73
1.24
CIO
0.18 0.29 0.5
2.77 0.93
Cil
0.19 0.38 0.51
2.68
1.49
C12
0.21
0.4
0.53 2.52
1.43
C13
0.24 0.4
0.53 2.21
1.25
C14
0.2
0.32 0.51
2.55
1
C15
0.2
0.35 0.5
2.5
1.225
The points Si to S 5 dénoté the inner harbour locations and locations
C9 to Cl5 dénoté the outer harbour locations. The average value of Cu
across the sample points in the inner and outer harbour area is found to
be about 2.4 and 2.5. The average value of Cc is about 1.09 and 1.2, from
which we can understand that the soil sample is well graded. The Cu and
Cc in the inner harbour locations are found to be less compared to the
locations in the outer harbour locations.
2.4 Plasticity
It is necessary to hâve a relatively simple test that reflects the influence
of the size and nature of the particles. This is accomplished by the liquid
limit (LL) and plastic limit (PL). Tests to détermine these limits are highly
arbitrary, but they nonetheless hâve great practical value. The liquid limit is
defined as the moisture content at which soil begins to behave as a liquid
material and begins to flow. The liquid limit is determined in the lab as
the moisture content at which the two sides of a groove formed in soil
corne together and touch for a distance of 2 inch after 25 blows. Details are
available in ASTM [2017].
Atterberg defined the plastic limit of clay as the limit of the moisture
content up to which it exhibits plastic property and below it becomes friable
or crumbly.
The plasticity index is the différence between the liquid and plastic
limits. It dénotés the range of water content over which the remolded clay
exhibits characteristics of a plastic material.
25
Table 2.2. Bed sédiment characteristics.
Locations jDio
D30
Ceo
Cu
Cc
SI
0.21
0.3
0.4
1.9
1.07
S2
0.2
0.26 0.38
1.9
0.88
S3
0.19 0.41
0.52 2.73
1.7
S4
0.17 0.27 0.5
2.94 0.85
S5
0.19 0.3
0.49 2.57 0.96
C9
0.19 0.35 0.52
2.73
1.24
CIO
0.18 0.29 0.5
2.77 0.93
Cil
0.19 0.38 0.51
2.68
1.49
C12
0.21
0.4
0.53 2.52
1.43
C13
0.24 0.4
0.53 2.21
1.25
C14
0.2
0.32 0.51
2.55
1
C15
0.2
0.35 0.5
2.5
1.225
The points Si to S 5 dénoté the inner harbour locations and locations
C9 to Cl5 dénoté the outer harbour locations. The average value of Cu
across the sample points in the inner and outer harbour area is found to
be about 2.4 and 2.5. The average value of Cc is about 1.09 and 1.2, from
which we can understand that the soil sample is well graded. The Cu and
Cc in the inner harbour locations are found to be less compared to the
locations in the outer harbour locations.
2.4 Plasticity
It is necessary to hâve a relatively simple test that reflects the influence
of the size and nature of the particles. This is accomplished by the liquid
limit (LL) and plastic limit (PL). Tests to détermine these limits are highly
arbitrary, but they nonetheless hâve great practical value. The liquid limit is
defined as the moisture content at which soil begins to behave as a liquid
material and begins to flow. The liquid limit is determined in the lab as
the moisture content at which the two sides of a groove formed in soil
corne together and touch for a distance of 2 inch after 25 blows. Details are
available in ASTM [2017].
Atterberg defined the plastic limit of clay as the limit of the moisture
content up to which it exhibits plastic property and below it becomes friable
or crumbly.
The plasticity index is the différence between the liquid and plastic
limits. It dénotés the range of water content over which the remolded clay
exhibits characteristics of a plastic material.