

324
Coastal Engineering: Theory and Practice
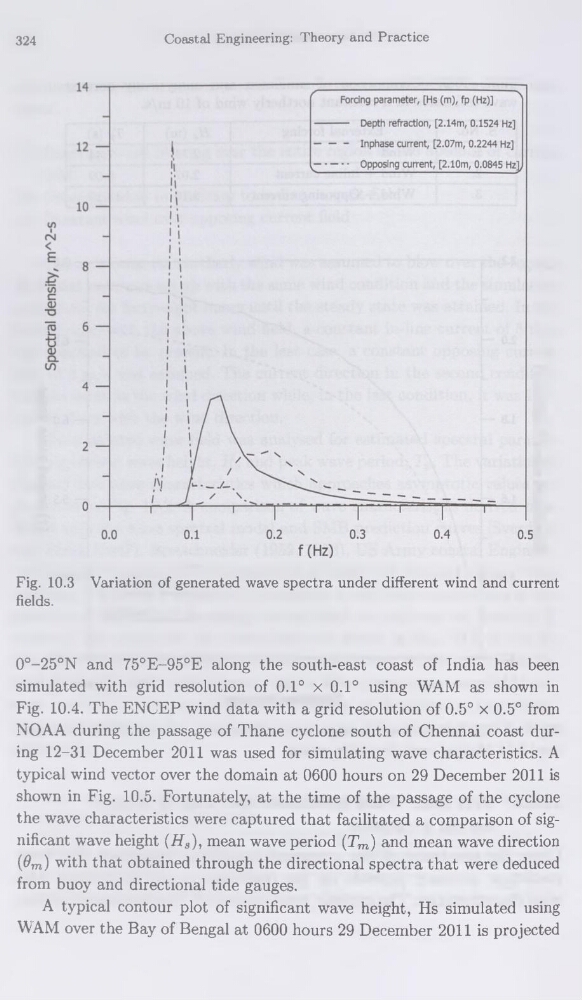
Fig. 10.3 Variation of generated wave spectra under different wind and current
fields.
0°-25°N and 75°E-95°E along the south-east coast of India has been
simulated with grid resolution of 0.1° x 0.1° using WAM as shown in
Fig. 10.4. The ENCEP wind data with a grid resolution of 0.5° x 0.5° from
NOAA during the passage of Thane cyclone south of Chennai coast during 12-31 December 2011 was used for simulating wave characteristics. A
typical wind vector over the domain at 0600 hours on 29 December 2011 is
shown in Fig. 10.5. Fortunately, at the time of the passage of the cyclone
the wave characteristics were captured that facilitated a comparison of significant wave height (H3), mean wave period (Tm) and mean wave direction
(#m) with that obtained through the directional spectra that were deduced
from buoy and directional tide gauges.
A typical contour plot of significant wave height, Hs simulated using
WAM over the Bay of Bengal at 0600 hours 29 December 2011 is projected
Coastal Engineering: Theory and Practice
Fig. 10.3 Variation of generated wave spectra under different wind and current
fields.
0°-25°N and 75°E-95°E along the south-east coast of India has been
simulated with grid resolution of 0.1° x 0.1° using WAM as shown in
Fig. 10.4. The ENCEP wind data with a grid resolution of 0.5° x 0.5° from
NOAA during the passage of Thane cyclone south of Chennai coast during 12-31 December 2011 was used for simulating wave characteristics. A
typical wind vector over the domain at 0600 hours on 29 December 2011 is
shown in Fig. 10.5. Fortunately, at the time of the passage of the cyclone
the wave characteristics were captured that facilitated a comparison of significant wave height (H3), mean wave period (Tm) and mean wave direction
(#m) with that obtained through the directional spectra that were deduced
from buoy and directional tide gauges.
A typical contour plot of significant wave height, Hs simulated using
WAM over the Bay of Bengal at 0600 hours 29 December 2011 is projected