

238
Coastal Engineering: Theory and Practice
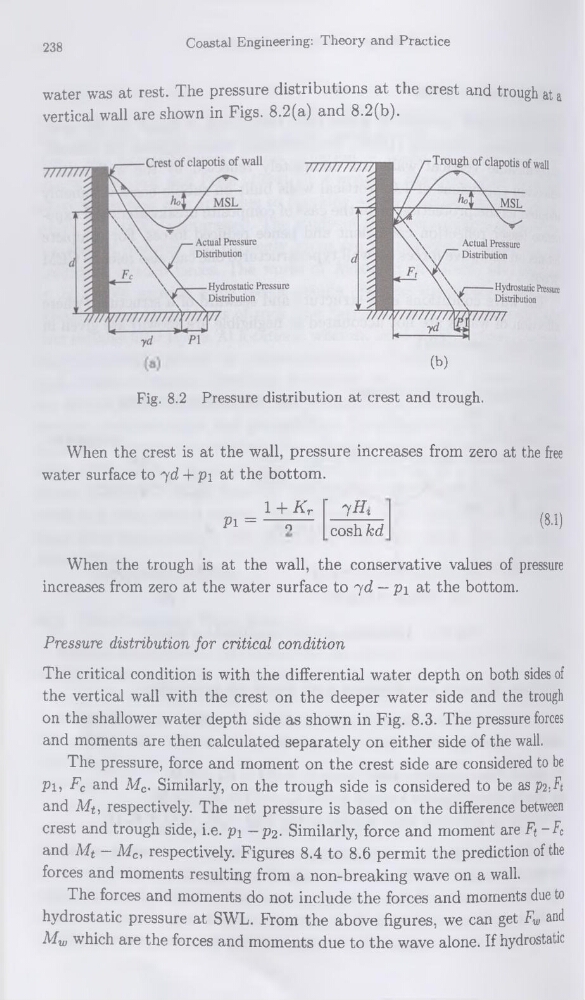
water was at rest. The pressure distributions at the crest and trough at a
vertical wall are shown in Figs. 8.2(a) and 8.2(b).
Fig. 8.2 Pressure distribution at crest and trough.
(b)
When the crest is at the wall, pressure increases from zéro at the free
water surface to yd 4- pi at the bottom.
1 + Kr
Pi = —7—
' 7#*
cosh kd
(8.1)
When the trough is at the wall, the conservative values of pressure
increases from zéro at the water surface to yd — pi at the bottom.
Pressure distribution for critical condition
The critical condition is with the differential water depth on both sides of
the vertical wall with the crest on the deeper water side and the trough
on the shallower water depth side as shown in Fig. 8.3. The pressure forces
and moments are then calculated separately on either side of the wall.
The pressure, force and moment on the crest side are considered to be
Pi, Fc and Mc. Similarly, on the trough side is considered to be as p2,?t
and Mf, respectively. The net pressure is based on the différence between
crest and trough side, i.e. pi ~P2- Similarly, force and moment are Ft -Fe
and Mt — Mc, respectively. Figures 8.4 to 8.6 permit the prédiction of the
forces and moments resulting from a non-breaking wave on a wall.
The forces and moments do not include the forces and moments due to
hydrostatic pressure at SWL. From the above figures, we can get Fw and
Mw which are the forces and moments due to the wave alone. If hydrostatic
Coastal Engineering: Theory and Practice
water was at rest. The pressure distributions at the crest and trough at a
vertical wall are shown in Figs. 8.2(a) and 8.2(b).
Fig. 8.2 Pressure distribution at crest and trough.
(b)
When the crest is at the wall, pressure increases from zéro at the free
water surface to yd 4- pi at the bottom.
1 + Kr
Pi = —7—
' 7#*
cosh kd
(8.1)
When the trough is at the wall, the conservative values of pressure
increases from zéro at the water surface to yd — pi at the bottom.
Pressure distribution for critical condition
The critical condition is with the differential water depth on both sides of
the vertical wall with the crest on the deeper water side and the trough
on the shallower water depth side as shown in Fig. 8.3. The pressure forces
and moments are then calculated separately on either side of the wall.
The pressure, force and moment on the crest side are considered to be
Pi, Fc and Mc. Similarly, on the trough side is considered to be as p2,?t
and Mf, respectively. The net pressure is based on the différence between
crest and trough side, i.e. pi ~P2- Similarly, force and moment are Ft -Fe
and Mt — Mc, respectively. Figures 8.4 to 8.6 permit the prédiction of the
forces and moments resulting from a non-breaking wave on a wall.
The forces and moments do not include the forces and moments due to
hydrostatic pressure at SWL. From the above figures, we can get Fw and
Mw which are the forces and moments due to the wave alone. If hydrostatic