

7. Scour Around Marine Structures
223
(d)
(e)
(f)
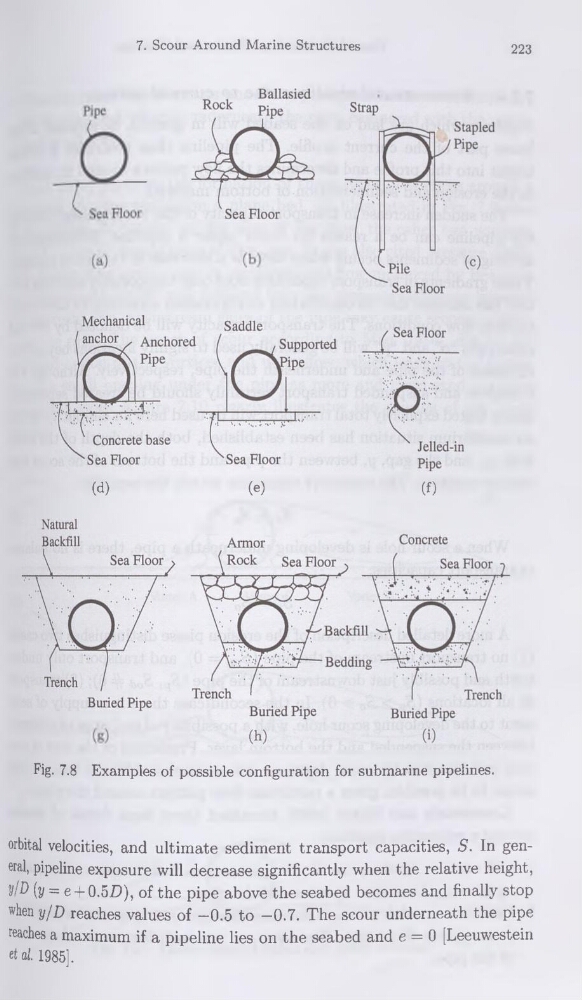
Fig. 7.8 Examples of possible configuration for submarine pipelines.
orbital velocities, and ultimate sédiment transport capacities, S. In general, pipeline exposure will decrease significantly when the relative height,
y/D (y = e + 0.5B), of the pipe above the seabed becomes and finally stop
when y/D reaches values of —0.5 to —0.7. The scour underneath the pipe
reaches a maximum if a pipeline lies on the seabed and e = 0 [Leeuwestein
et al. 1985],
223
(d)
(e)
(f)
Fig. 7.8 Examples of possible configuration for submarine pipelines.
orbital velocities, and ultimate sédiment transport capacities, S. In general, pipeline exposure will decrease significantly when the relative height,
y/D (y = e + 0.5B), of the pipe above the seabed becomes and finally stop
when y/D reaches values of —0.5 to —0.7. The scour underneath the pipe
reaches a maximum if a pipeline lies on the seabed and e = 0 [Leeuwestein
et al. 1985],