

6. Wave Run-up and Overtopping
199
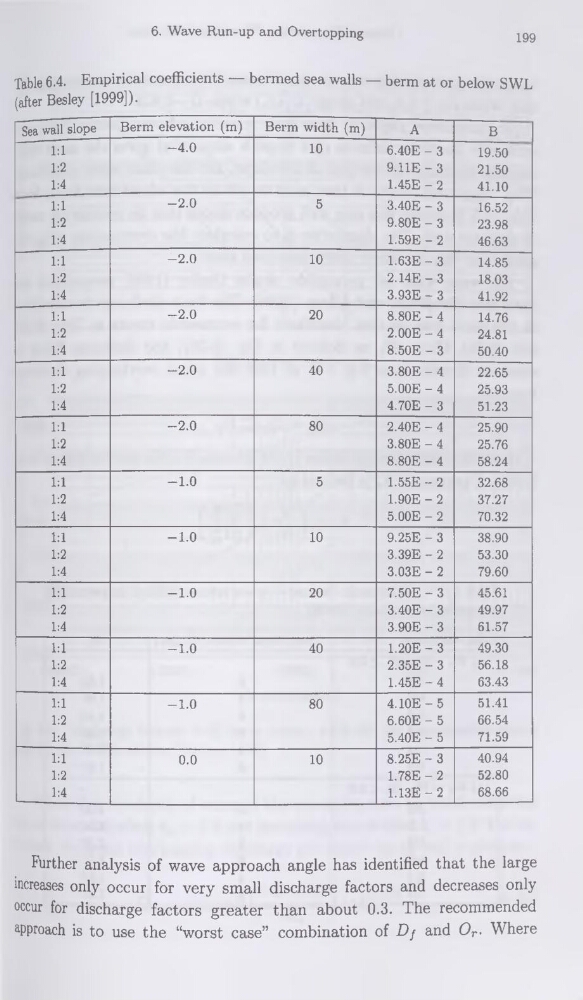
Table 6.4. Empirical coefficients — bermed sea walls — berm at or below SWL
(after Besley [1999]).
Sea wall slope
Berm élévation (m)
Berm width (m)
A
B
1:1
-4.0
10
6.40E - 3
19.50
1:2
9.11E - 3
21.50
1:4
1.45E - 2
41.10
1:1
-2.0
5
3.40E - 3
16.52
1:2
9.80E - 3
23.98
1:4
1.59E - 2
46.63
1:1
-2.0
10
1.63E - 3
14.85
1:2
2.14E-3
18.03
1:4
3.93E - 3
41.92
1:1
-2.0
20
8.80E - 4
14.76
1:2
2.00E - 4
24.81
1:4
8.50E - 3
50.40
1:1
-2.0
40
3.80E - 4
22.65
1:2
5.00E - 4
25.93
1:4
4.70E - 3
51.23
1:1
-2.0
80
2.40E - 4
25.90
1:2
3.80E - 4
25.76
1:4
8.80E - 4
58.24
1:1
-1.0
5
1.55E - 2
32.68
1:2
1.90E - 2
37.27
1:4
5.00E - 2
70.32
1:1
-1.0
10
9.25E - 3
38.90
1:2
3.39E - 2
53.30
1:4
3.03E - 2
79.60
1:1
-1.0
20
7.50E - 3
45.61
1:2
3.40E - 3
49.97
1:4
3.90E - 3
61.57
1:1
-1.0
40
1.20E - 3
49.30
1:2
2.35E - 3
56.18
1:4
1.45E - 4
63.43
1:1
-1.0
80
4.10E-5
51.41
1:2
6.60E - 5
66.54
1:4
5.40E - 5
71.59
1:1
0.0
10
8.25E - 3
40.94
1:2
1.78E - 2
52.80
1:4
1.13E-2
68.66
Further analysis of wave approach angle has identified that the large
increases only occur for very small discharge factors and decreases only
occur for discharge factors greater than about 0.3. The recommended
approach is to use the “worst case” combination of Df and Or- Where
199
Table 6.4. Empirical coefficients — bermed sea walls — berm at or below SWL
(after Besley [1999]).
Sea wall slope
Berm élévation (m)
Berm width (m)
A
B
1:1
-4.0
10
6.40E - 3
19.50
1:2
9.11E - 3
21.50
1:4
1.45E - 2
41.10
1:1
-2.0
5
3.40E - 3
16.52
1:2
9.80E - 3
23.98
1:4
1.59E - 2
46.63
1:1
-2.0
10
1.63E - 3
14.85
1:2
2.14E-3
18.03
1:4
3.93E - 3
41.92
1:1
-2.0
20
8.80E - 4
14.76
1:2
2.00E - 4
24.81
1:4
8.50E - 3
50.40
1:1
-2.0
40
3.80E - 4
22.65
1:2
5.00E - 4
25.93
1:4
4.70E - 3
51.23
1:1
-2.0
80
2.40E - 4
25.90
1:2
3.80E - 4
25.76
1:4
8.80E - 4
58.24
1:1
-1.0
5
1.55E - 2
32.68
1:2
1.90E - 2
37.27
1:4
5.00E - 2
70.32
1:1
-1.0
10
9.25E - 3
38.90
1:2
3.39E - 2
53.30
1:4
3.03E - 2
79.60
1:1
-1.0
20
7.50E - 3
45.61
1:2
3.40E - 3
49.97
1:4
3.90E - 3
61.57
1:1
-1.0
40
1.20E - 3
49.30
1:2
2.35E - 3
56.18
1:4
1.45E - 4
63.43
1:1
-1.0
80
4.10E-5
51.41
1:2
6.60E - 5
66.54
1:4
5.40E - 5
71.59
1:1
0.0
10
8.25E - 3
40.94
1:2
1.78E - 2
52.80
1:4
1.13E-2
68.66
Further analysis of wave approach angle has identified that the large
increases only occur for very small discharge factors and decreases only
occur for discharge factors greater than about 0.3. The recommended
approach is to use the “worst case” combination of Df and Or- Where