

86
V. Gouretski
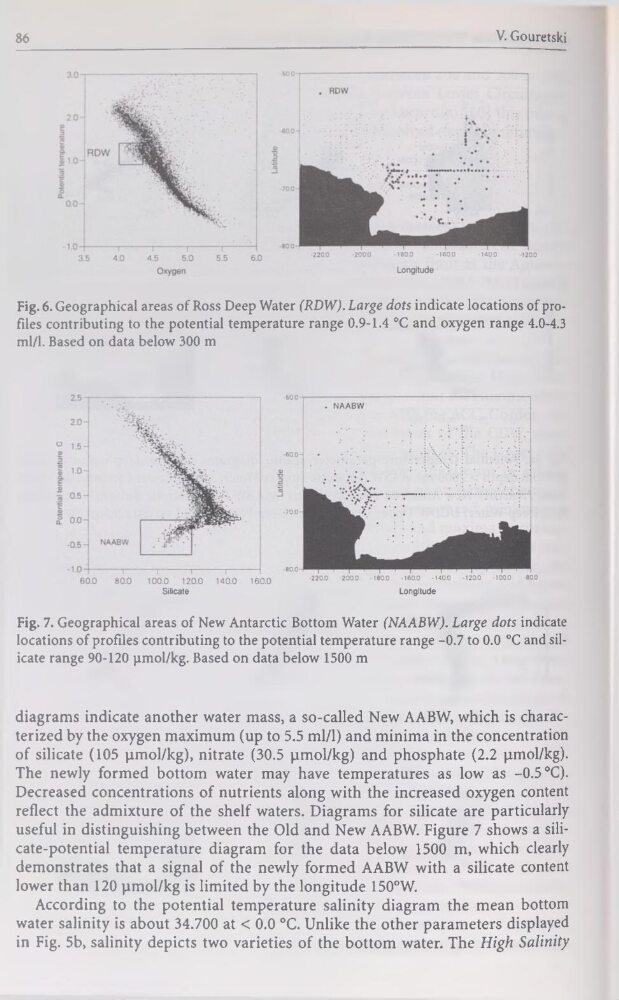
Fig. 6. Geographical areas of Ross Deep Water (RDW). Large dots indicate locations of profiles contributing to the potential température range 0.9-1.4 °C and oxygen range 4.0-4.3
ml/1. Based on data below 300 m
Silicate
Longitude
Fig. 7. Geographical areas of New Antarctic Bottom Water (NAABW). Large dots indicate
locations of profiles contributing to the potential température range -0.7 to 0.0 °C and silicate range 90-120 pmol/kg. Based on data below 1500 m
diagrams indicate another water mass, a so-called New AABW, which is characterized by the oxygen maximum (up to 5.5 ml/1) and minima in the concentration
of silicate (105 pmol/kg), nitrate (30.5 pmol/kg) and phosphate (2.2 pmol/kg).
The newly formed bottom water may hâve températures as low as -0.5 °C).
Decreased concentrations of nutrients along with the increased oxygen content
reflect the admixture of the shelf waters. Diagrams for silicate are particularly
useful in distinguishing between the Old and New AABW. Figure 7 shows a silicate-potential température diagram for the data below 1500 m, which clearly
demonstrates that a signal of the newly formed AABW with a silicate content
lower than 120 pmol/kg is limited by the longitude 150°W.
According to the potential température salinity diagram the mean bottom
water salinity is about 34.700 at < 0.0 °C. Unlike the other parameters displayed
in Fig. 5b, salinity depicts two varieties of the bottom water. The High Salinity
V. Gouretski
Fig. 6. Geographical areas of Ross Deep Water (RDW). Large dots indicate locations of profiles contributing to the potential température range 0.9-1.4 °C and oxygen range 4.0-4.3
ml/1. Based on data below 300 m
Silicate
Longitude
Fig. 7. Geographical areas of New Antarctic Bottom Water (NAABW). Large dots indicate
locations of profiles contributing to the potential température range -0.7 to 0.0 °C and silicate range 90-120 pmol/kg. Based on data below 1500 m
diagrams indicate another water mass, a so-called New AABW, which is characterized by the oxygen maximum (up to 5.5 ml/1) and minima in the concentration
of silicate (105 pmol/kg), nitrate (30.5 pmol/kg) and phosphate (2.2 pmol/kg).
The newly formed bottom water may hâve températures as low as -0.5 °C).
Decreased concentrations of nutrients along with the increased oxygen content
reflect the admixture of the shelf waters. Diagrams for silicate are particularly
useful in distinguishing between the Old and New AABW. Figure 7 shows a silicate-potential température diagram for the data below 1500 m, which clearly
demonstrates that a signal of the newly formed AABW with a silicate content
lower than 120 pmol/kg is limited by the longitude 150°W.
According to the potential température salinity diagram the mean bottom
water salinity is about 34.700 at < 0.0 °C. Unlike the other parameters displayed
in Fig. 5b, salinity depicts two varieties of the bottom water. The High Salinity