

62
A. Simone et al.
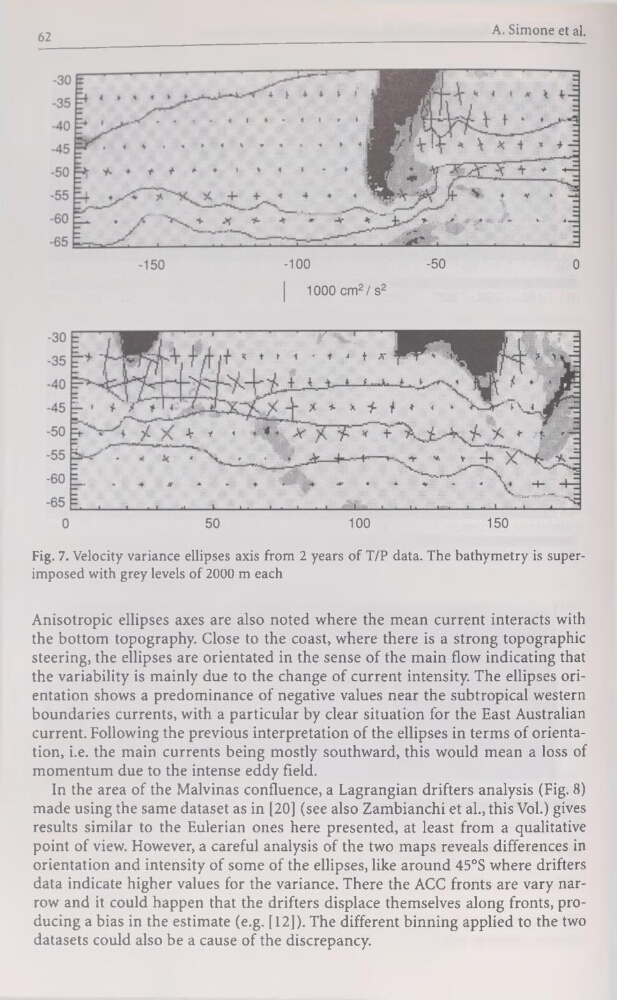
Fig. 7. Velocity variance ellipses axis from 2 years of T/P data. The bathymetry is superimposed with grey levels of 2000 m each
Anisotropic ellipses axes are also noted where the mean current interacts with
the bottom topography. Close to the coast, where there is a strong topographie
steering, the ellipses are orientated in the sense of the main flow indicating that
the variability is mainly due to the change of current intensity. The ellipses orientation shows a prédominance of négative values near the subtropical western
boundaries currents, with a particular by clear situation for the East Australian
current. Following the previous interprétation of the ellipses in terms of orientation, i.e. the main currents being mostly southward, this would mean a loss of
momentum due to the intense eddy field.
In the area of the Malvinas confluence, a Lagrangian drifters analysis (Fig. 8)
made using the same dataset as in [20] (see also Zambianchi et al., this Vol.) gives
results similar to the Eulerian ones here presented, at least from a qualitative
point of view. However, a careful analysis of the two maps reveals différences in
orientation and intensity of some of the ellipses, like around 45°S where drifters
data indicate higher values for the variance. There the ACC fronts are vary narrow and it could happen that the drifters displace themselves along fronts, producing a bias in the estimate (e.g. [12]). The different binning applied to the two
datasets could also be a cause of the discrepancy.
A. Simone et al.
Fig. 7. Velocity variance ellipses axis from 2 years of T/P data. The bathymetry is superimposed with grey levels of 2000 m each
Anisotropic ellipses axes are also noted where the mean current interacts with
the bottom topography. Close to the coast, where there is a strong topographie
steering, the ellipses are orientated in the sense of the main flow indicating that
the variability is mainly due to the change of current intensity. The ellipses orientation shows a prédominance of négative values near the subtropical western
boundaries currents, with a particular by clear situation for the East Australian
current. Following the previous interprétation of the ellipses in terms of orientation, i.e. the main currents being mostly southward, this would mean a loss of
momentum due to the intense eddy field.
In the area of the Malvinas confluence, a Lagrangian drifters analysis (Fig. 8)
made using the same dataset as in [20] (see also Zambianchi et al., this Vol.) gives
results similar to the Eulerian ones here presented, at least from a qualitative
point of view. However, a careful analysis of the two maps reveals différences in
orientation and intensity of some of the ellipses, like around 45°S where drifters
data indicate higher values for the variance. There the ACC fronts are vary narrow and it could happen that the drifters displace themselves along fronts, producing a bias in the estimate (e.g. [12]). The different binning applied to the two
datasets could also be a cause of the discrepancy.