

Vertical Distribution and Biochemical Composition of Pico-and Microparticulate
239
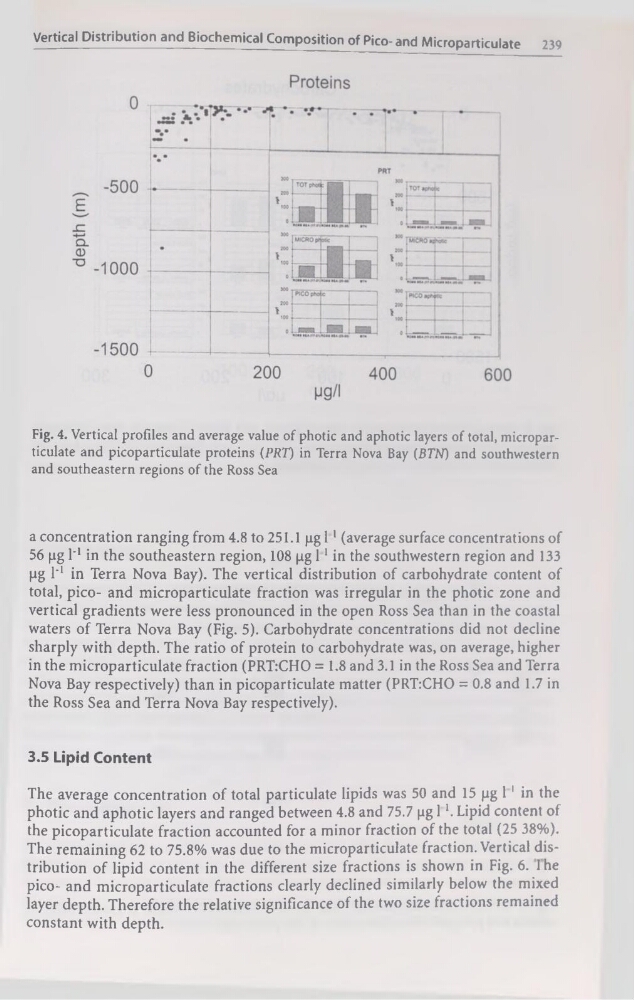
Fig. 4. Vertical profiles and average value of photic and aphotic layers of total, microparticulate and picoparticulate proteins (PRT) in Terra Nova Bay (BTN) and southwestern
and southeastern régions of the Ross Sea
a concentration ranging from 4.8 to 251.1 pg l1 (average surface concentrations of
56 pg l'1 in the southeastern région, 108 pg l1 in the southwestern région and 133
pg l'1 in Terra Nova Bay). The vertical distribution of carbohydrate content of
total, pico- and microparticulate fraction was irregular in the photic zone and
vertical gradients were less pronounced in the open Ross Sea than in the Coastal
waters of Terra Nova Bay (Fig. 5). Carbohydrate concentrations did not décliné
sharply with depth. The ratio of protein to carbohydrate was, on average, higher
in the microparticulate fraction (PRT:CHO = 1.8 and 3.1 in the Ross Sea and Terra
Nova Bay respectively) than in picoparticulate matter (PRT:CHO = 0.8 and 1.7 in
the Ross Sea and Terra Nova Bay respectively).
3.5 Lipid Content
The average concentration of total particulate lipids was 50 and 15 pg 1 1 in the
photic and aphotic layers and ranged between 4.8 and 75.7 pg l1. Lipid content of
the picoparticulate fraction accounted for a minor fraction of the total (25 38%).
The remaining 62 to 75.8% was due to the microparticulate fraction. Vertical distribution of lipid content in the different size fractions is shown in Fig. 6. I he
pico- and microparticulate fractions clearly declined similarly below the mixed
layer depth. Therefore the relative significance of the two size fractions remained
constant with depth.
239
Fig. 4. Vertical profiles and average value of photic and aphotic layers of total, microparticulate and picoparticulate proteins (PRT) in Terra Nova Bay (BTN) and southwestern
and southeastern régions of the Ross Sea
a concentration ranging from 4.8 to 251.1 pg l1 (average surface concentrations of
56 pg l'1 in the southeastern région, 108 pg l1 in the southwestern région and 133
pg l'1 in Terra Nova Bay). The vertical distribution of carbohydrate content of
total, pico- and microparticulate fraction was irregular in the photic zone and
vertical gradients were less pronounced in the open Ross Sea than in the Coastal
waters of Terra Nova Bay (Fig. 5). Carbohydrate concentrations did not décliné
sharply with depth. The ratio of protein to carbohydrate was, on average, higher
in the microparticulate fraction (PRT:CHO = 1.8 and 3.1 in the Ross Sea and Terra
Nova Bay respectively) than in picoparticulate matter (PRT:CHO = 0.8 and 1.7 in
the Ross Sea and Terra Nova Bay respectively).
3.5 Lipid Content
The average concentration of total particulate lipids was 50 and 15 pg 1 1 in the
photic and aphotic layers and ranged between 4.8 and 75.7 pg l1. Lipid content of
the picoparticulate fraction accounted for a minor fraction of the total (25 38%).
The remaining 62 to 75.8% was due to the microparticulate fraction. Vertical distribution of lipid content in the different size fractions is shown in Fig. 6. I he
pico- and microparticulate fractions clearly declined similarly below the mixed
layer depth. Therefore the relative significance of the two size fractions remained
constant with depth.