

Vertical Distribution and Biochemical Composition of Rico- and Microparticulate
237
2.5 Data Analysis
Différences between TSM, lipid, protein, carbohydrate and ATP contents of the
pico- and microparticulate fractions of particulate matter were tested using
analysis of variance (ANOVA). A Mann-Whitney Test was carried out on nontransformed data, when homogeneity of variance was rejected by an Fmax test.
Pearson's product-moment corrélation analysis was used initially to examine
relationships between the distributions of different classes of organic compounds
and environmental parameters.
3 Results
3.1 Hydrography
The depth of the photic zone and of the mixed layers (Zmjx) at the different stations is reported in Table 1. The upper water column was well stratified through -
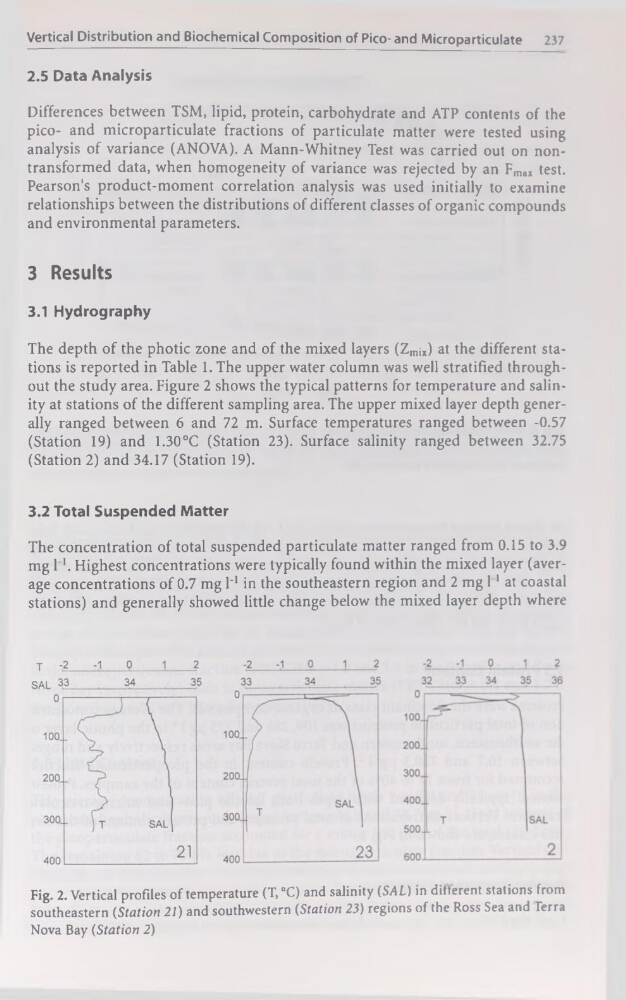
out the study area. Figure 2 shows the typical patterns for température and salinity at stations of the different sampling area. The upper mixed layer depth generally ranged between 6 and 72 m. Surface températures ranged between -0.57
(Station 19) and 1.30°C (Station 23). Surface salinity ranged between 32.75
(Station 2) and 34.17 (Station 19).
3.2 Total Suspended Matter
The concentration of total suspended particulate matter ranged from 0.15 to 3.9
mg l1. Highest concentrations were typically found within the mixed layer (average concentrations of 0.7 mg l'1 in the southeastern région and 2 mg 1 1 at Coastal
stations) and generally showed little change below the mixed layer depth where
Fig. 2. Vertical profiles of température (T, °C) and salinity (SAL) in different stations from
southeastern (Station 21) and southwestern (Station 23) régions of the Ross Sea and Terra
Nova Bay (Station 2)
237
2.5 Data Analysis
Différences between TSM, lipid, protein, carbohydrate and ATP contents of the
pico- and microparticulate fractions of particulate matter were tested using
analysis of variance (ANOVA). A Mann-Whitney Test was carried out on nontransformed data, when homogeneity of variance was rejected by an Fmax test.
Pearson's product-moment corrélation analysis was used initially to examine
relationships between the distributions of different classes of organic compounds
and environmental parameters.
3 Results
3.1 Hydrography
The depth of the photic zone and of the mixed layers (Zmjx) at the different stations is reported in Table 1. The upper water column was well stratified through -
out the study area. Figure 2 shows the typical patterns for température and salinity at stations of the different sampling area. The upper mixed layer depth generally ranged between 6 and 72 m. Surface températures ranged between -0.57
(Station 19) and 1.30°C (Station 23). Surface salinity ranged between 32.75
(Station 2) and 34.17 (Station 19).
3.2 Total Suspended Matter
The concentration of total suspended particulate matter ranged from 0.15 to 3.9
mg l1. Highest concentrations were typically found within the mixed layer (average concentrations of 0.7 mg l'1 in the southeastern région and 2 mg 1 1 at Coastal
stations) and generally showed little change below the mixed layer depth where
Fig. 2. Vertical profiles of température (T, °C) and salinity (SAL) in different stations from
southeastern (Station 21) and southwestern (Station 23) régions of the Ross Sea and Terra
Nova Bay (Station 2)