

202
S. Tucci et al.
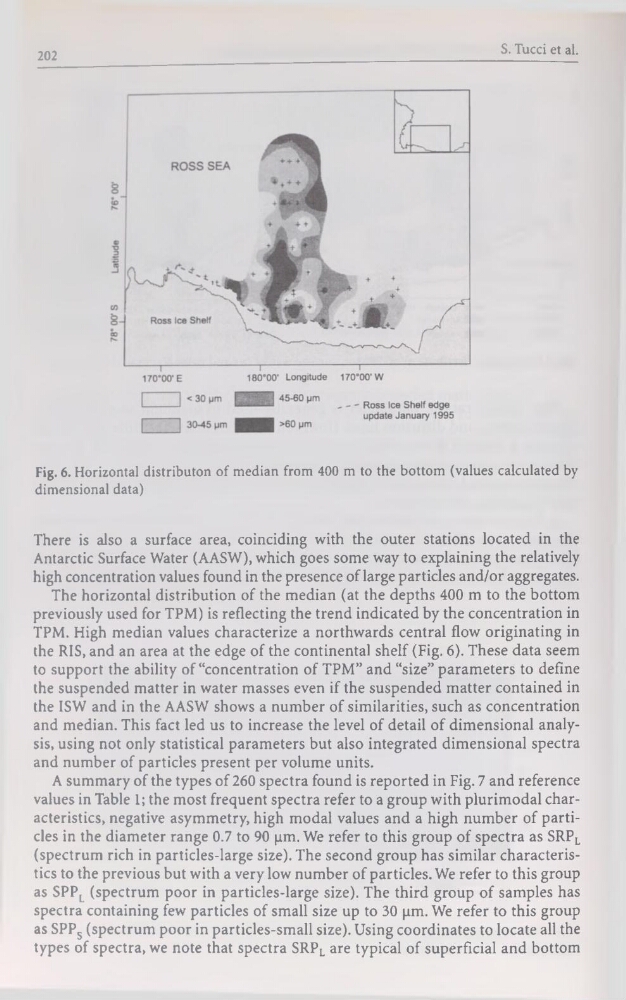
Fig. 6. Horizontal distributon of médian from 400 m to the bottom (values calculated by
dimensional data)
There is also a surface area, coinciding with the outer stations located in the
Antarctic Surface Water (AASW), which goes some way to explaining the relatively
high concentration values found in the presence of large particles and/or aggregates.
The horizontal distribution of the médian (at the depths 400 m to the bottom
previously used for TPM) is reflecting the trend indicated by the concentration in
TPM. High médian values characterize a northwards central flow originating in
the RIS, and an area at the edge of the continental shelf (Fig. 6). These data seem
to support the ability of “concentration of TPM” and “size” parameters to define
the suspended matter in water masses even if the suspended matter contained in
the ISW and in the AASW shows a number of similarities, such as concentration
and médian. This fact led us to increase the level of detail of dimensional analysis, using not only statistical parameters but also integrated dimensional spectra
and number of particles présent per volume units.
A summary of the types of 260 spectra found is reported in Fig. 7 and reference
values in Table 1; the most frequent spectra refer to a group with plurimodal characteristics, négative asymmetry, high modal values and a high number of particles in the diameter range 0.7 to 90 pm. We refer to this group of spectra as SRPL
(spectrum rich in particles-large size). The second group has similar characteristics to the previous but with a very low number of particles. We refer to this group
as SPPL (spectrum poor in particles-large size). The third group of samples has
spectra containing few particles of small size up to 30 pm. We refer to this group
as SPPs (spectrum poor in particles-small size). Using coordinates to locate ail the
types of spectra, we note that spectra SRPL are typical of superficial and bottom
S. Tucci et al.
Fig. 6. Horizontal distributon of médian from 400 m to the bottom (values calculated by
dimensional data)
There is also a surface area, coinciding with the outer stations located in the
Antarctic Surface Water (AASW), which goes some way to explaining the relatively
high concentration values found in the presence of large particles and/or aggregates.
The horizontal distribution of the médian (at the depths 400 m to the bottom
previously used for TPM) is reflecting the trend indicated by the concentration in
TPM. High médian values characterize a northwards central flow originating in
the RIS, and an area at the edge of the continental shelf (Fig. 6). These data seem
to support the ability of “concentration of TPM” and “size” parameters to define
the suspended matter in water masses even if the suspended matter contained in
the ISW and in the AASW shows a number of similarities, such as concentration
and médian. This fact led us to increase the level of detail of dimensional analysis, using not only statistical parameters but also integrated dimensional spectra
and number of particles présent per volume units.
A summary of the types of 260 spectra found is reported in Fig. 7 and reference
values in Table 1; the most frequent spectra refer to a group with plurimodal characteristics, négative asymmetry, high modal values and a high number of particles in the diameter range 0.7 to 90 pm. We refer to this group of spectra as SRPL
(spectrum rich in particles-large size). The second group has similar characteristics to the previous but with a very low number of particles. We refer to this group
as SPPL (spectrum poor in particles-large size). The third group of samples has
spectra containing few particles of small size up to 30 pm. We refer to this group
as SPPs (spectrum poor in particles-small size). Using coordinates to locate ail the
types of spectra, we note that spectra SRPL are typical of superficial and bottom