

Actual Sédimentation on the Antarctic Continental Shelf...
201
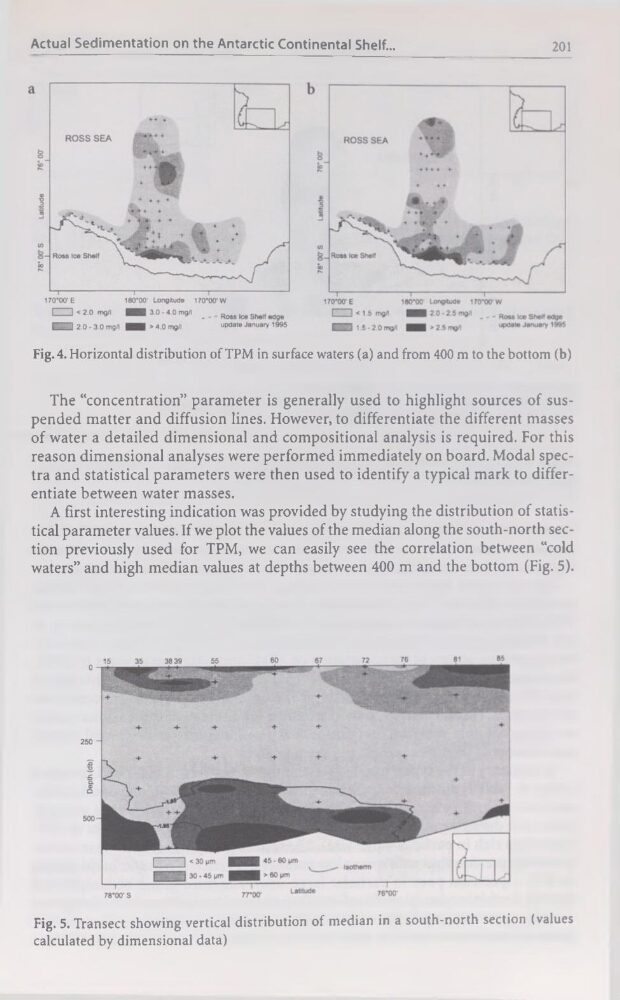
Fig. 4. Horizontal distribution of TPM in surface waters (a) and from 400 m to the bottom (b)
The “concentration” parameter is generally used to highlight sources of suspended matter and diffusion lines. However, to differentiate the different masses
of water a detailed dimensional and compositional analysis is required. For this
reason dimensional analyses were performed immediately on board. Modal spectra and statistical parameters were then used to identify a typical mark to differentiate between water masses.
A first interesting indication was provided by studying the distribution of statistical parameter values. If we plot the values of the médian along the south-north section previously used for TPM, we can easily see the corrélation between “cold
waters” and high médian values at depths between 400 m and the bottom (Fig. 5).
Fig. 5. Transect showing vertical distribution of médian in a south-north section (values
calculated by dimensional data)
201
Fig. 4. Horizontal distribution of TPM in surface waters (a) and from 400 m to the bottom (b)
The “concentration” parameter is generally used to highlight sources of suspended matter and diffusion lines. However, to differentiate the different masses
of water a detailed dimensional and compositional analysis is required. For this
reason dimensional analyses were performed immediately on board. Modal spectra and statistical parameters were then used to identify a typical mark to differentiate between water masses.
A first interesting indication was provided by studying the distribution of statistical parameter values. If we plot the values of the médian along the south-north section previously used for TPM, we can easily see the corrélation between “cold
waters” and high médian values at depths between 400 m and the bottom (Fig. 5).
Fig. 5. Transect showing vertical distribution of médian in a south-north section (values
calculated by dimensional data)