

S.S. Jacobs, C.F. Giulivi
4
of représentative zonal and méridional transects, along with a brief description of
the primary water masses and their probable sources and sinks. Temporal variability in the océan thermohaline data over recent décades in this sector is discussed in more detail by Jacobs and Giulivi [15].
2 The Data Base and Seasonal Variability
Température and salinity data south of the 600-m isobath near the continental
shelf break were winnowed from National Océanographie Data Center (NODC)
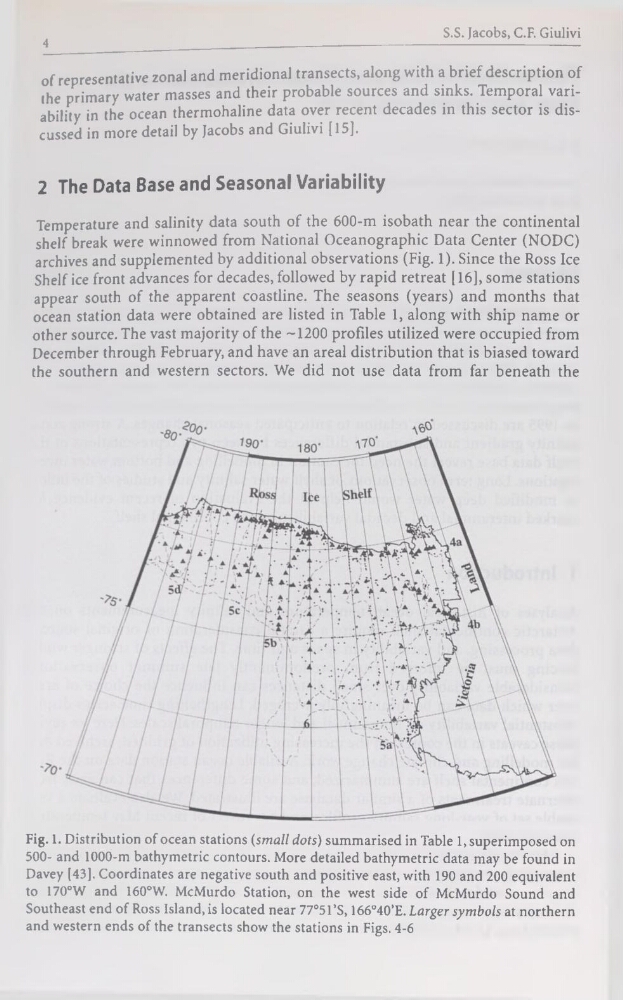
archives and supplemented by additional observations (Fig. 1). Since the Ross Ice
Shelf ice front advances for décades, followed by rapid retreat [16], some stations
appear south of the apparent coastline. The seasons (years) and months that
océan station data were obtained are listed in Table 1, along with ship name or
other source. The vast majority of the -1200 profiles utilized were occupied from
December through February, and hâve an areal distribution that is biased toward
the Southern and western sectors. We did not use data from far beneath the
Fig. 1. Distribution of océan stations (srnall dots) summarised in Table 1, superimposed on
500- and 1000-m bathymétrie contours. More detailed bathymétrie data may be found in
Davey [43]. Coordinates are négative south and positive east, with 190 and 200 équivalent
to 170°W and 160°W. McMurdo Station, on the west side of McMurdo Sound and
Southeast end of Ross Island, is located near 77°51’S, 166°40’E. Larger symbols at northern
and western ends of the transects show the stations in Figs. 4-6
4
of représentative zonal and méridional transects, along with a brief description of
the primary water masses and their probable sources and sinks. Temporal variability in the océan thermohaline data over recent décades in this sector is discussed in more detail by Jacobs and Giulivi [15].
2 The Data Base and Seasonal Variability
Température and salinity data south of the 600-m isobath near the continental
shelf break were winnowed from National Océanographie Data Center (NODC)
archives and supplemented by additional observations (Fig. 1). Since the Ross Ice
Shelf ice front advances for décades, followed by rapid retreat [16], some stations
appear south of the apparent coastline. The seasons (years) and months that
océan station data were obtained are listed in Table 1, along with ship name or
other source. The vast majority of the -1200 profiles utilized were occupied from
December through February, and hâve an areal distribution that is biased toward
the Southern and western sectors. We did not use data from far beneath the
Fig. 1. Distribution of océan stations (srnall dots) summarised in Table 1, superimposed on
500- and 1000-m bathymétrie contours. More detailed bathymétrie data may be found in
Davey [43]. Coordinates are négative south and positive east, with 190 and 200 équivalent
to 170°W and 160°W. McMurdo Station, on the west side of McMurdo Sound and
Southeast end of Ross Island, is located near 77°51’S, 166°40’E. Larger symbols at northern
and western ends of the transects show the stations in Figs. 4-6