

122
A. Bergamasco et al.
2.2 . Topography
An accurate bathymetry is used. Starting from GEBCO digital Atlas bathymetry
extending until 78°S with a resolution of 1/12°, the model was implemented with
an ad hoc one digitalized by authors for the topography below the RIS and the ice
thickness [1].
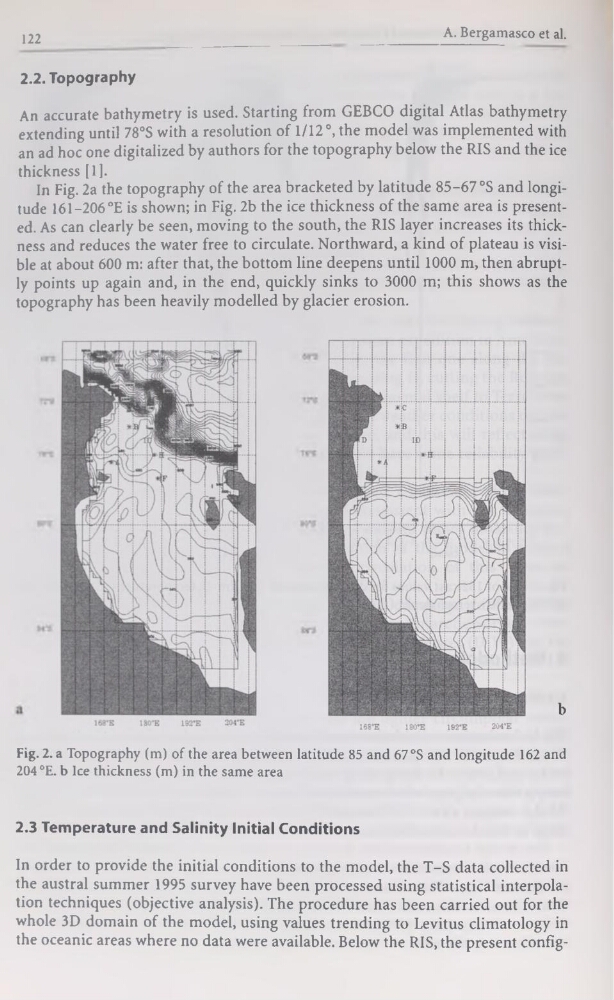
In Fig. 2a the topography of the area bracketed by latitude 85-67 °S and longitude 161-206 °E is shown; in Fig. 2b the ice thickness of the same area is presented. As can clearly be seen, moving to the south, the RIS layer increases its thickness and reduces the water free to circulate. Northward, a kind of plateau is visible at about 600 m: after that, the bottom line deepens until 1000 m, then abruptly points up again and, in the end, quickly sinks to 3000 m; this shows as the
topography has been heavily modelled by glacier érosion.
Fig. 2. a Topography (m) of the area between latitude 85 and 67 °S and longitude 162 and
204 °E. b Ice thickness (m) in the same area
b
2.3 Température and Salinity Initial Conditions
In order to provide the initial conditions to the model, the T-S data collected in
the austral summer 1995 survey hâve been processed using statistical interpolation techniques (objective analysis). The procedure has been carried out for the
whole 3D domain of the model, using values trending to Levitus climatology in
the oceanic areas where no data were available. Below the RIS, the présent config
A. Bergamasco et al.
2.2 . Topography
An accurate bathymetry is used. Starting from GEBCO digital Atlas bathymetry
extending until 78°S with a resolution of 1/12°, the model was implemented with
an ad hoc one digitalized by authors for the topography below the RIS and the ice
thickness [1].
In Fig. 2a the topography of the area bracketed by latitude 85-67 °S and longitude 161-206 °E is shown; in Fig. 2b the ice thickness of the same area is presented. As can clearly be seen, moving to the south, the RIS layer increases its thickness and reduces the water free to circulate. Northward, a kind of plateau is visible at about 600 m: after that, the bottom line deepens until 1000 m, then abruptly points up again and, in the end, quickly sinks to 3000 m; this shows as the
topography has been heavily modelled by glacier érosion.
Fig. 2. a Topography (m) of the area between latitude 85 and 67 °S and longitude 162 and
204 °E. b Ice thickness (m) in the same area
b
2.3 Température and Salinity Initial Conditions
In order to provide the initial conditions to the model, the T-S data collected in
the austral summer 1995 survey hâve been processed using statistical interpolation techniques (objective analysis). The procedure has been carried out for the
whole 3D domain of the model, using values trending to Levitus climatology in
the oceanic areas where no data were available. Below the RIS, the présent config