

112
P- Picco et al.
antidockwise.clockwise and total frequency components were derived according
to Gonella [9]; finally, an average of the sections was performed.
In spite of these attempts, no clear resuit could be achieved, except that in the
semidiurnal band, the clockwise signal is generally stronger than the anticlockwise one, indicating a little weight of inertia current phenomenum during the
overall period, which does not exclude short lasting events (Fig. 5). Spectral
analysis revealed a strong prédominance of diurnal components with respect to
semidiurnal ones, which is in complété agreement with previous results as outlined by Lutjeharms et al. [10], who particularly quoted several sea-level measurements performed in the Ross Sea since the beginning of the twentieth century up to 1979. Analogous outcome was determined by Stocchino and Manzella
[11], who analysed currents in the area of Terra Nova Bay.
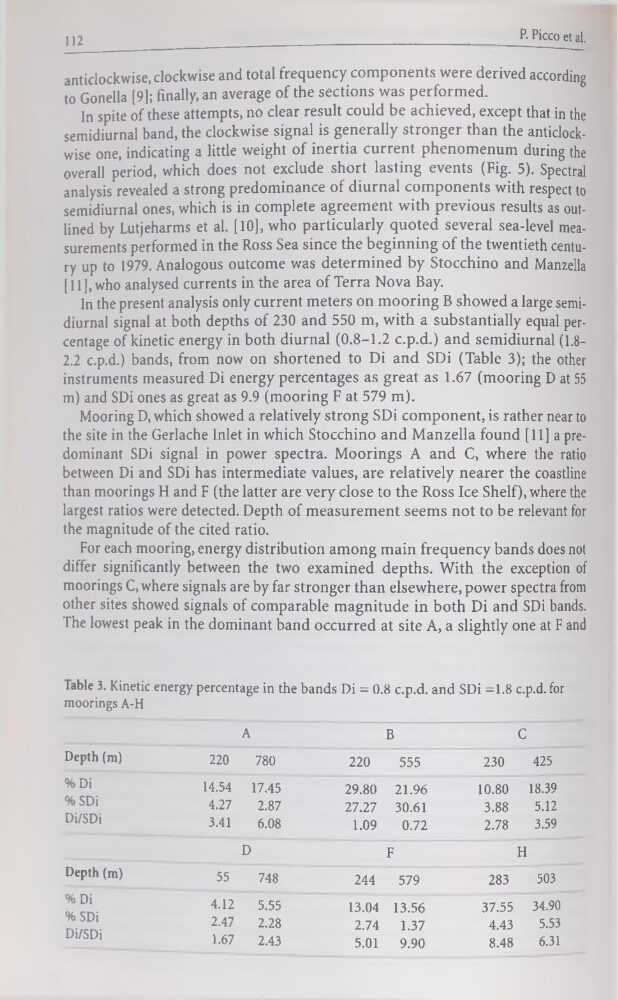
In the présent analysis only current meters on mooring B showed a large semidiurnal signal at both depths of 230 and 550 m, with a substantially equal percentage of kinetic energy in both diurnal (0.8-1.2 c.p.d.) and semidiurnal (1.82.2 c.p.d.) bands, from now on shortened to Di and SDi (Table 3); the other
instruments measured Di energy percentages as great as 1.67 (mooring D at 55
m) and SDi ones as great as 9.9 (mooring F at 579 m).
Mooring D, which showed a relatively strong SDi component, is rather near to
the site in the Gerlache Inlet in which Stocchino and Manzella found [11] a prédominant SDi signal in power spectra. Moorings A and C, where the ratio
between Di and SDi has intermediate values, are relatively nearer the coastline
than moorings H and F (the latter are very close to the Ross Ice Shelf), where the
largest ratios were detected. Depth of measurement seems not to be relevant for
the magnitude of the cited ratio.
For each mooring, energy distribution among main frequency bands does not
differ significantly between the two examined depths. With the exception of
moorings C, where signais are by far stronger than elsewhere, power spectra from
other sites showed signais of comparable magnitude in both Di and SDi bands.
The lowest peak in the dominant band occurred at site A, a slightly one at F and
Table 3. Kinetic energy percentage in the bands Di = 0.8 c.p.d. and SDi =1.8 c.p.d. for
moorings A-H
A
B
C
Depth (m)
220
780
220
555
230
425
%Di
14.54 17.45
29.80 21.96
10.80
18.39
% SDi
4.27
2.87
27.27 30.61
3.88
5.12
Di/SDi
3.41
6.08
1.09
0.72
2.78
3.59
D
F
H
Depth (m)
55
748
244
579
283
503
%Di
4.12
5.55
13.04 13.56
37.55 34.90
% SDi
2.47
2.28
2.74
1.37
4.43
5.53
Di/SDi
1.67
2.43
5.01
9.90
8.48
6.31
P- Picco et al.
antidockwise.clockwise and total frequency components were derived according
to Gonella [9]; finally, an average of the sections was performed.
In spite of these attempts, no clear resuit could be achieved, except that in the
semidiurnal band, the clockwise signal is generally stronger than the anticlockwise one, indicating a little weight of inertia current phenomenum during the
overall period, which does not exclude short lasting events (Fig. 5). Spectral
analysis revealed a strong prédominance of diurnal components with respect to
semidiurnal ones, which is in complété agreement with previous results as outlined by Lutjeharms et al. [10], who particularly quoted several sea-level measurements performed in the Ross Sea since the beginning of the twentieth century up to 1979. Analogous outcome was determined by Stocchino and Manzella
[11], who analysed currents in the area of Terra Nova Bay.
In the présent analysis only current meters on mooring B showed a large semidiurnal signal at both depths of 230 and 550 m, with a substantially equal percentage of kinetic energy in both diurnal (0.8-1.2 c.p.d.) and semidiurnal (1.82.2 c.p.d.) bands, from now on shortened to Di and SDi (Table 3); the other
instruments measured Di energy percentages as great as 1.67 (mooring D at 55
m) and SDi ones as great as 9.9 (mooring F at 579 m).
Mooring D, which showed a relatively strong SDi component, is rather near to
the site in the Gerlache Inlet in which Stocchino and Manzella found [11] a prédominant SDi signal in power spectra. Moorings A and C, where the ratio
between Di and SDi has intermediate values, are relatively nearer the coastline
than moorings H and F (the latter are very close to the Ross Ice Shelf), where the
largest ratios were detected. Depth of measurement seems not to be relevant for
the magnitude of the cited ratio.
For each mooring, energy distribution among main frequency bands does not
differ significantly between the two examined depths. With the exception of
moorings C, where signais are by far stronger than elsewhere, power spectra from
other sites showed signais of comparable magnitude in both Di and SDi bands.
The lowest peak in the dominant band occurred at site A, a slightly one at F and
Table 3. Kinetic energy percentage in the bands Di = 0.8 c.p.d. and SDi =1.8 c.p.d. for
moorings A-H
A
B
C
Depth (m)
220
780
220
555
230
425
%Di
14.54 17.45
29.80 21.96
10.80
18.39
% SDi
4.27
2.87
27.27 30.61
3.88
5.12
Di/SDi
3.41
6.08
1.09
0.72
2.78
3.59
D
F
H
Depth (m)
55
748
244
579
283
503
%Di
4.12
5.55
13.04 13.56
37.55 34.90
% SDi
2.47
2.28
2.74
1.37
4.43
5.53
Di/SDi
1.67
2.43
5.01
9.90
8.48
6.31