

110
P. Picco et al.
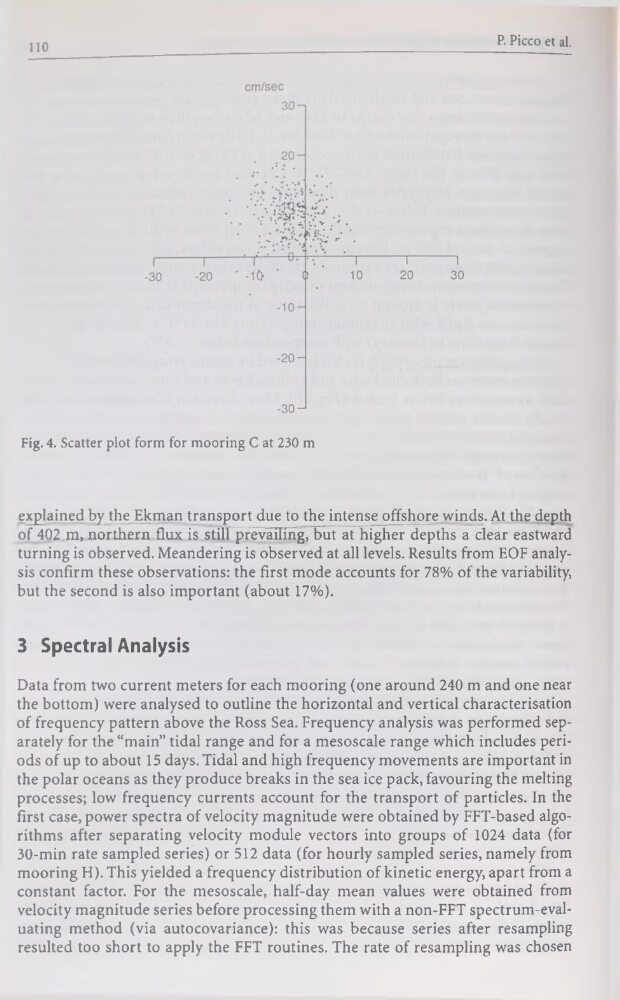
Fig- 4. Scatter plot form for mooring C at 230 m
explained by the Ekman transport due to the intense offshore winds. At the depth
of 402 m, northern flux is still prevailing, but at higher depths a clear eastward
turning is observed. Meandering is observed at ail levels. Results from EOF analysis confirm these observations: the first mode accounts for 78% of the variability,
but the second is also important (about 17%).
3 Spectral Analysis
Data from two current meters for each mooring (one around 240 m and one near
the bottom) were analysed to outline the horizontal and vertical characterisation
of frequency pattern above the Ross Sea. Frequency analysis was performed separately for the “main” tidal range and for a mesoscale range which includes periods of up to about 15 days. Tidal and high frequency movements are important in
the polar océans as they produce breaks in the sea ice pack, favouring the melting
processes; low frequency currents account for the transport of particles. In the
first case, power spectra of velocity magnitude were obtained by FFT-based algorithms after separating velocity module vectors into groups of 1024 data (for
30-min rate sampled sériés) or 512 data (for hourly sampled sériés, namely from
mooring H). This yielded a frequency distribution of kinetic energy, apart from a
constant factor. For the mesoscale, half-day mean values were obtained from
velocity magnitude sériés before processing them with a non-FFT spectrum-evaluating method (via autocovariance): this was because sériés after resampling
resulted too short to apply the FFT routines. The rate of resampling was chosen
P. Picco et al.
Fig- 4. Scatter plot form for mooring C at 230 m
explained by the Ekman transport due to the intense offshore winds. At the depth
of 402 m, northern flux is still prevailing, but at higher depths a clear eastward
turning is observed. Meandering is observed at ail levels. Results from EOF analysis confirm these observations: the first mode accounts for 78% of the variability,
but the second is also important (about 17%).
3 Spectral Analysis
Data from two current meters for each mooring (one around 240 m and one near
the bottom) were analysed to outline the horizontal and vertical characterisation
of frequency pattern above the Ross Sea. Frequency analysis was performed separately for the “main” tidal range and for a mesoscale range which includes periods of up to about 15 days. Tidal and high frequency movements are important in
the polar océans as they produce breaks in the sea ice pack, favouring the melting
processes; low frequency currents account for the transport of particles. In the
first case, power spectra of velocity magnitude were obtained by FFT-based algorithms after separating velocity module vectors into groups of 1024 data (for
30-min rate sampled sériés) or 512 data (for hourly sampled sériés, namely from
mooring H). This yielded a frequency distribution of kinetic energy, apart from a
constant factor. For the mesoscale, half-day mean values were obtained from
velocity magnitude sériés before processing them with a non-FFT spectrum-evaluating method (via autocovariance): this was because sériés after resampling
resulted too short to apply the FFT routines. The rate of resampling was chosen