

Flow in pressurized conduits 75
Computer code 4.2
% Example 4.2 Water Hammer Analysis
% r = Pipe radius [m];
% c = Celeriy of the elastic wave [m/s];
% ho = upstream pressure head [m];
% fc = Pipe friction coefficient;
% tv = Valve closing time [s];
% Dt = Time step [s];
% Dx = Spatial step [m];
% nx = Number of discrete spatial points;
% nt = Number of time steps;
% u = Water velocity;
% h = Piezometric head;
clc; clear all; close all;
% Input data;
r=1;
c=500;
ho=5;
fc=0.05;
tv=5; tv1=20; tv2=40;
Dt=0.02;
Dx=50;
nx=100;
tn=10000;
g=9.81;
25
20
15
10
5
0
–5
–10
0
1000 2000 3000 4000 5000 6000 7000 8000 9000 10,000
Time (s)
Pressure head at the end of the pipe (m)
Valve closing time = 5 s
Valve closing time = 20 s
Valve closing time = 40 s
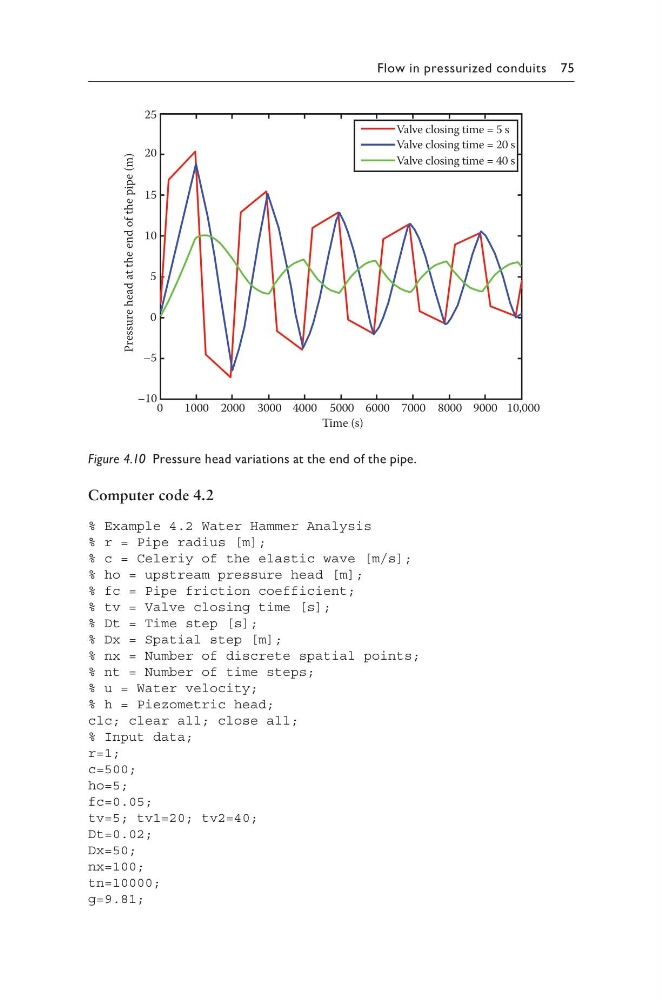
Figure 4.10 Pressure head variations at the end of the pipe.
Computer code 4.2
% Example 4.2 Water Hammer Analysis
% r = Pipe radius [m];
% c = Celeriy of the elastic wave [m/s];
% ho = upstream pressure head [m];
% fc = Pipe friction coefficient;
% tv = Valve closing time [s];
% Dt = Time step [s];
% Dx = Spatial step [m];
% nx = Number of discrete spatial points;
% nt = Number of time steps;
% u = Water velocity;
% h = Piezometric head;
clc; clear all; close all;
% Input data;
r=1;
c=500;
ho=5;
fc=0.05;
tv=5; tv1=20; tv2=40;
Dt=0.02;
Dx=50;
nx=100;
tn=10000;
g=9.81;
25
20
15
10
5
0
–5
–10
0
1000 2000 3000 4000 5000 6000 7000 8000 9000 10,000
Time (s)
Pressure head at the end of the pipe (m)
Valve closing time = 5 s
Valve closing time = 20 s
Valve closing time = 40 s
Figure 4.10 Pressure head variations at the end of the pipe.