

184 Computational Modelling in Hydraulic and Coastal Engineering
points N = 0, for impervious boundaries N = 1, and for constant head
boundary n is a real number different than 0 or 1 expressed in metres.
Finally, the N corresponding to the location of the well is indicative of
the well flow rate in cubic metres per hour (m 3 /hr). Other data used for
the simulation are as follows:
Permeability coefficient = 0.5 m/hr
Porosity = 0.2
Area of the solution domain = 15,000 m × 15,000 m
Spatial steps equal in both x- and y-directions = 500 m
Time step = 24 hours
The simulation was conducted for a period of 7200 time steps (20
years). The pumping rate of the well is constant and equal to 400 m 3 /hr.
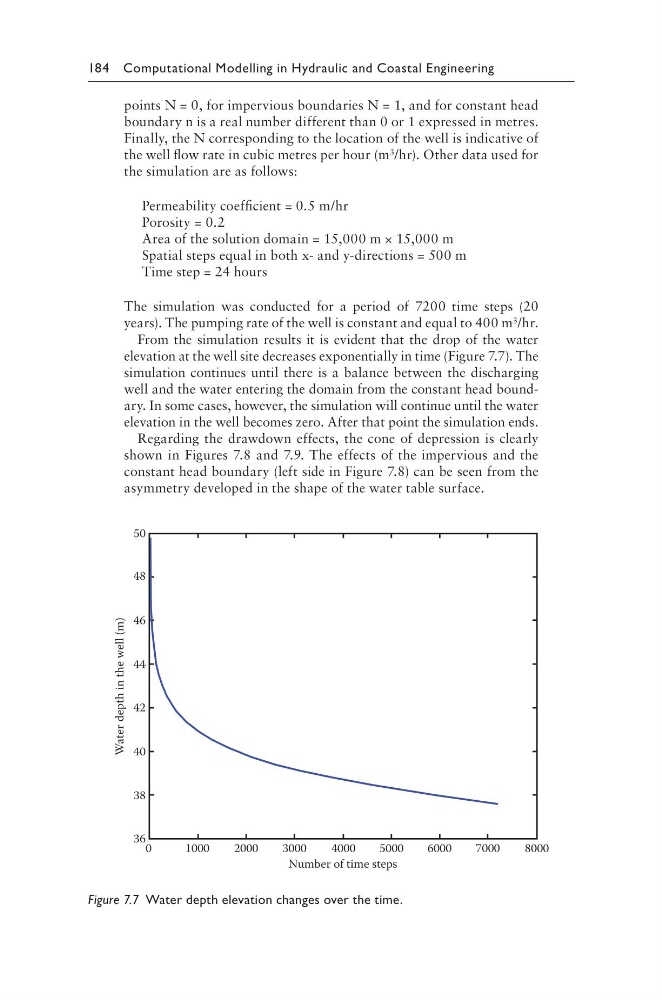
From the simulation results it is evident that the drop of the water
elevation at the well site decreases exponentially in time (Figure 7.7). The
simulation continues until there is a balance between the discharging
well and the water entering the domain from the constant head boundary. In some cases, however, the simulation will continue until the water
elevation in the well becomes zero. After that point the simulation ends.
Regarding the drawdown effects, the cone of depression is clearly
shown in Figures 7.8 and 7.9. The effects of the impervious and the
constant head boundary (left side in Figure 7.8) can be seen from the
asymmetry developed in the shape of the water table surface.
50
48
46
44
42
40
38
36
0
1000
2000
3000
4000
5000
6000
7000
8000
Number of time steps
Water depth in the well (m)
Figure 7.7 Water depth elevation changes over the time.
points N = 0, for impervious boundaries N = 1, and for constant head
boundary n is a real number different than 0 or 1 expressed in metres.
Finally, the N corresponding to the location of the well is indicative of
the well flow rate in cubic metres per hour (m 3 /hr). Other data used for
the simulation are as follows:
Permeability coefficient = 0.5 m/hr
Porosity = 0.2
Area of the solution domain = 15,000 m × 15,000 m
Spatial steps equal in both x- and y-directions = 500 m
Time step = 24 hours
The simulation was conducted for a period of 7200 time steps (20
years). The pumping rate of the well is constant and equal to 400 m 3 /hr.
From the simulation results it is evident that the drop of the water
elevation at the well site decreases exponentially in time (Figure 7.7). The
simulation continues until there is a balance between the discharging
well and the water entering the domain from the constant head boundary. In some cases, however, the simulation will continue until the water
elevation in the well becomes zero. After that point the simulation ends.
Regarding the drawdown effects, the cone of depression is clearly
shown in Figures 7.8 and 7.9. The effects of the impervious and the
constant head boundary (left side in Figure 7.8) can be seen from the
asymmetry developed in the shape of the water table surface.
50
48
46
44
42
40
38
36
0
1000
2000
3000
4000
5000
6000
7000
8000
Number of time steps
Water depth in the well (m)
Figure 7.7 Water depth elevation changes over the time.