

100 Computational Modelling in Hydraulic and Coastal Engineering
upstream boundary condition was the inflow hydrograph Q in (m 3 /s)
defined as
Q
t
for t
s
in =
− ×
≤ ×
2000 1 5 10
5 10
4
4
and
Q in = 0 for t > 5 × 10 4 s
The downstream boundary condition was defined as free flow. The
spatial and temporal discretization steps were selected as Δx = 1000
m and Δt = 5 s.
The computation was conducted for a period T d of 250,000 seconds (69,44 hours) simulating the dam-break water release duration.
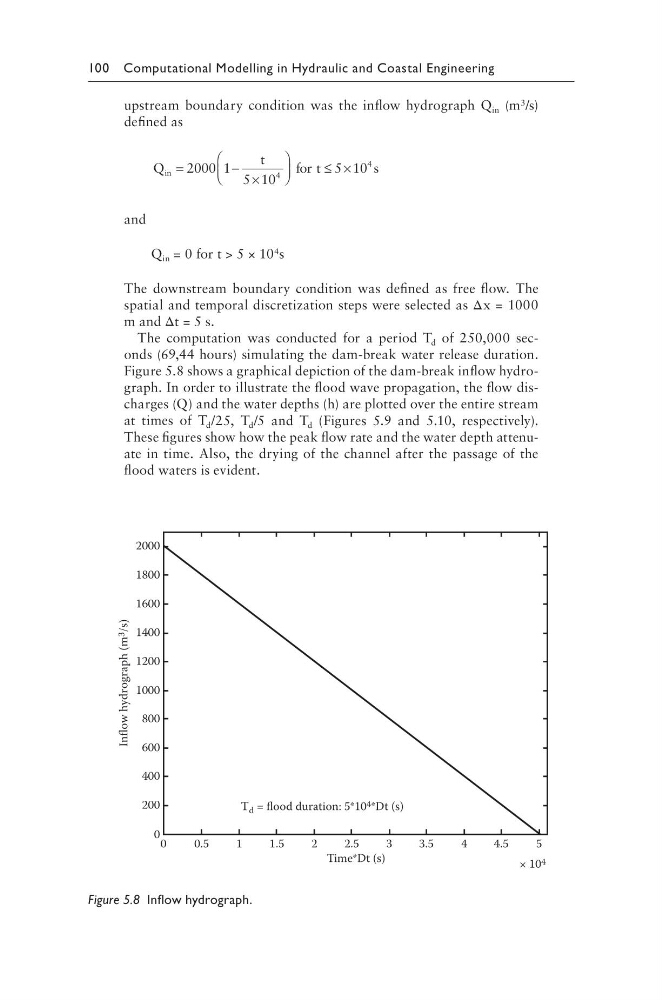
Figure 5.8 shows a graphical depiction of the dam-break inflow hydrograph. In order to illustrate the flood wave propagation, the flow discharges (Q) and the water depths (h) are plotted over the entire stream
at times of T d /25, T d /5 and T d (Figures 5.9 and 5.10, respectively).
These figures show how the peak flow rate and the water depth attenuate in time. Also, the drying of the channel after the passage of the
flood waters is evident.
2000
1800
1600
1400
1200
1000
800
600
400
200
0 0
0.5
1
1.5
2
2.5
3
3.5
4
4.5
5
Time*Dt (s)
× 10 4
Inflow hydrograph (m 3
/s)
T d = flood duration: 5*10 4 *Dt (s)
Figure 5.8 Inflow hydrograph.
upstream boundary condition was the inflow hydrograph Q in (m 3 /s)
defined as
Q
t
for t
s
in =
− ×
≤ ×
2000 1 5 10
5 10
4
4
and
Q in = 0 for t > 5 × 10 4 s
The downstream boundary condition was defined as free flow. The
spatial and temporal discretization steps were selected as Δx = 1000
m and Δt = 5 s.
The computation was conducted for a period T d of 250,000 seconds (69,44 hours) simulating the dam-break water release duration.
Figure 5.8 shows a graphical depiction of the dam-break inflow hydrograph. In order to illustrate the flood wave propagation, the flow discharges (Q) and the water depths (h) are plotted over the entire stream
at times of T d /25, T d /5 and T d (Figures 5.9 and 5.10, respectively).
These figures show how the peak flow rate and the water depth attenuate in time. Also, the drying of the channel after the passage of the
flood waters is evident.
2000
1800
1600
1400
1200
1000
800
600
400
200
0 0
0.5
1
1.5
2
2.5
3
3.5
4
4.5
5
Time*Dt (s)
× 10 4
Inflow hydrograph (m 3
/s)
T d = flood duration: 5*10 4 *Dt (s)
Figure 5.8 Inflow hydrograph.