

SINGLE PILES UNDER AXIAL LOADING
295
0.5 up to the failure stress. Therefore, the other points on the load seulement
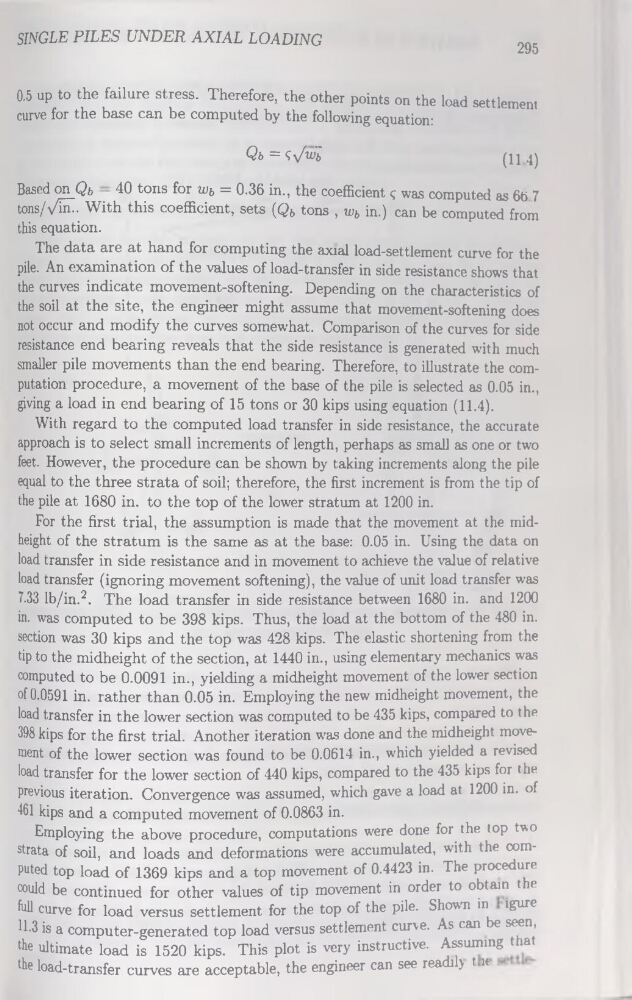
curve for the base can be computed by the following équation:
Qb =
Based on Qb 40 tons for wj, = 0.36 in., the coefficient ç was computed as 66 7
tons/v^ïïü. With this coefficient, sets (Qb tons , wb in.) can be computed from
this équation.
The data are at hand for computing the axial load-settlement curve for the
pile. An examination of the values of load-transfer in side résistance shows that
the curves indicate movement-softening. Depending on the characteristics of
the soil at the site, the engineer might assume that movement-softening does
not occur and modify the curves somewhat. Comparison of the curves for side
résistance end bearing reveals that the side résistance is generated with much
smaller pile movements than the end bearing. Therefore, to illustrate the computation procedure, a movement of the base of the pile is selected as 0.05 in.,
giving a load in end bearing of 15 tons or 30 kips using équation (11.4).
With regard to the computed load transfer in side résistance, the accurate
approach is to select small incréments of length, perhaps as small as one or two
feet. However, the procedure can be shown by taking incréments along the pile
equal to the three strata of soil; therefore, the first incrément is from the tip of
the pile at 1680 in. to the top of the lower stratum at 1200 in.
For the first trial, the assumption is made that the movement at the midheight of the stratum is the same as at the base: 0.05 in. Using the data on
load transfer in side résistance and in movement to achieve the value of relative
load transfer (ignoring movement softening), the value of unit load transfer was
7.33 lb/in.2. The load transfer in side résistance between 1680 in. and 1200
in. was computed to be 398 kips. Thus, the load at the bottom of the 480 in.
section was 30 kips and the top was 428 kips. The elastic shortening from the
tip to the midheight of the section, at 1440 in., using elementary mechanics was
computed to be 0.0091 in., yielding a midheight movement of the lower section
of 0.0591 in. rather than 0.05 in. Employing the new midheight movement, the
load transfer in the lower section was computed to be 435 kips, compared to the
398 kips for the first trial. Another itération was done and the midheight movement of the lower section was found to be 0.0614 in., which yielded a revised
load transfer for the lower section of 440 kips, compared to the 435 kips for the
previous itération. Convergence was assumed, which gave a load at 1200 in. of
461 kips and a computed movement of 0.0863 in.
Employing the above procedure, computations were done for the top two
strata of soil, and loads and deformations were accumulated, with the computed top load of 1369 kips and a top movement of 0.4423 in. The procedure
could be continued for other values of tip movement in order to obtain the
full curve for load versus settlement for the top of the pile. Shown in igure
11-3 is a computer-generated top load versus settlement curve. As can be seen,
the ultimate load is 1520 kips. This plot is very instructive. Assuming that
the load-transfer curves are acceptable, the engineer can see readilj t it
295
0.5 up to the failure stress. Therefore, the other points on the load seulement
curve for the base can be computed by the following équation:
Qb =
Based on Qb 40 tons for wj, = 0.36 in., the coefficient ç was computed as 66 7
tons/v^ïïü. With this coefficient, sets (Qb tons , wb in.) can be computed from
this équation.
The data are at hand for computing the axial load-settlement curve for the
pile. An examination of the values of load-transfer in side résistance shows that
the curves indicate movement-softening. Depending on the characteristics of
the soil at the site, the engineer might assume that movement-softening does
not occur and modify the curves somewhat. Comparison of the curves for side
résistance end bearing reveals that the side résistance is generated with much
smaller pile movements than the end bearing. Therefore, to illustrate the computation procedure, a movement of the base of the pile is selected as 0.05 in.,
giving a load in end bearing of 15 tons or 30 kips using équation (11.4).
With regard to the computed load transfer in side résistance, the accurate
approach is to select small incréments of length, perhaps as small as one or two
feet. However, the procedure can be shown by taking incréments along the pile
equal to the three strata of soil; therefore, the first incrément is from the tip of
the pile at 1680 in. to the top of the lower stratum at 1200 in.
For the first trial, the assumption is made that the movement at the midheight of the stratum is the same as at the base: 0.05 in. Using the data on
load transfer in side résistance and in movement to achieve the value of relative
load transfer (ignoring movement softening), the value of unit load transfer was
7.33 lb/in.2. The load transfer in side résistance between 1680 in. and 1200
in. was computed to be 398 kips. Thus, the load at the bottom of the 480 in.
section was 30 kips and the top was 428 kips. The elastic shortening from the
tip to the midheight of the section, at 1440 in., using elementary mechanics was
computed to be 0.0091 in., yielding a midheight movement of the lower section
of 0.0591 in. rather than 0.05 in. Employing the new midheight movement, the
load transfer in the lower section was computed to be 435 kips, compared to the
398 kips for the first trial. Another itération was done and the midheight movement of the lower section was found to be 0.0614 in., which yielded a revised
load transfer for the lower section of 440 kips, compared to the 435 kips for the
previous itération. Convergence was assumed, which gave a load at 1200 in. of
461 kips and a computed movement of 0.0863 in.
Employing the above procedure, computations were done for the top two
strata of soil, and loads and deformations were accumulated, with the computed top load of 1369 kips and a top movement of 0.4423 in. The procedure
could be continued for other values of tip movement in order to obtain the
full curve for load versus settlement for the top of the pile. Shown in igure
11-3 is a computer-generated top load versus settlement curve. As can be seen,
the ultimate load is 1520 kips. This plot is very instructive. Assuming that
the load-transfer curves are acceptable, the engineer can see readilj t it