

191
PROBLEMS
Input
Wave
Output: E [y2] « const.
/(/)
//to»
n
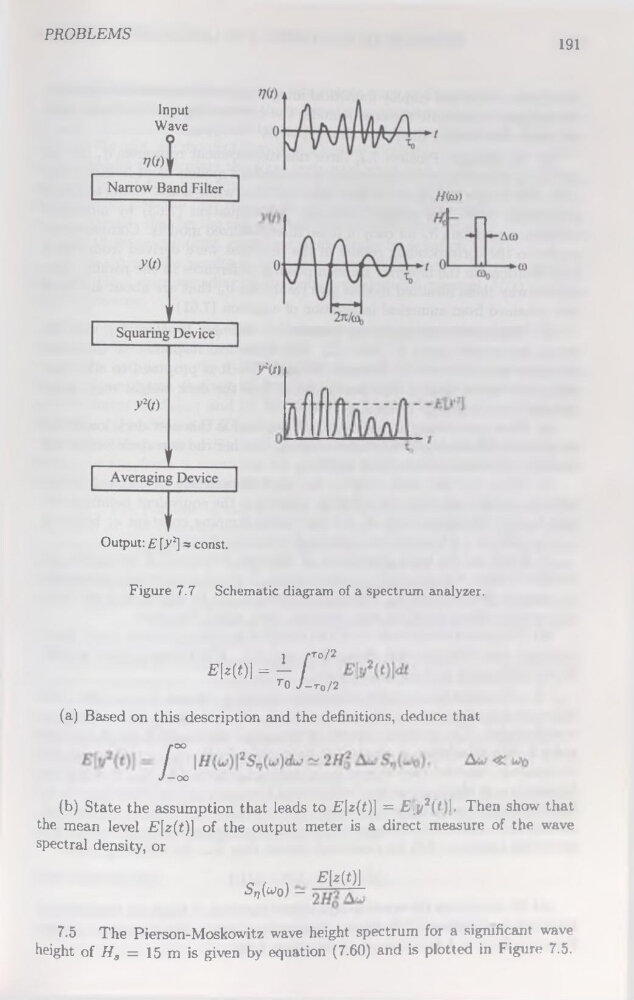
Figure 7.7 Schematic diagram of a spectrum analyzer.
1 /‘To/2
£[2(t)l = - /
T0 J-t0/2
(a) Based on this description and the définitions, deduce that
/
oo
-OO
(b) State the assumption that leads to £[z(£)] = £j/2(t)i. Then show that
the mean level E[z(t)] of the output meter is a direct measure of the wave
spectral density, or
S^û) -
£[-?(*)]
7-5
The Pierson-Moskowitz wave height spectrum for a sigmficant wave
height of Ha = 15 m is given by équation (7.60) and is plotted in Figure 7.5.
PROBLEMS
Input
Wave
Output: E [y2] « const.
/(/)
//to»
n
Figure 7.7 Schematic diagram of a spectrum analyzer.
1 /‘To/2
£[2(t)l = - /
T0 J-t0/2
(a) Based on this description and the définitions, deduce that
/
oo
-OO
(b) State the assumption that leads to £[z(£)] = £j/2(t)i. Then show that
the mean level E[z(t)] of the output meter is a direct measure of the wave
spectral density, or
S^û) -
£[-?(*)]
7-5
The Pierson-Moskowitz wave height spectrum for a sigmficant wave
height of Ha = 15 m is given by équation (7.60) and is plotted in Figure 7.5.