

RESPONSE TO EARTHQUAKE LOADING
121
is given to sufficient accuracy (without considération to initial conditions) by
équation (5.76), or
1 r
v(t) = —
v9(r)e“Cü/o(t_T) sin- r)dr
JO
(5-77)
For a structure with known characteristics üj0 and
then u>4 is calculated
from équation (5.71). Given an earthquake measurement of vg, the response
of this structure can then be calculated from the last équation by numerical
intégration. Such results are available in the open literature (Wiegel, 1970).
For instance, the measured time history of vg for the SOOE component of the
1940 El Centro earthquake shown in Figure 2.14 was used with équation (5.77)
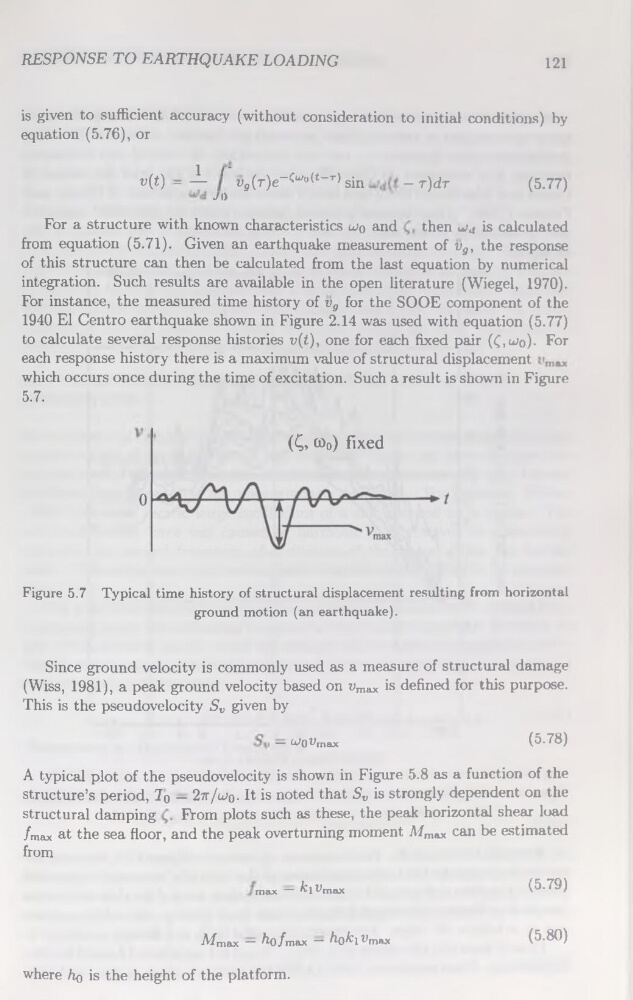
to calculate several response historiés v(t), one for each fixed pair (£,^o)- For
each response history there is a maximum value of structural displacement
which occurs once during the time of excitation. Such a resuit is shown in Figure
5.7.
(Ç, œ0) fixed
Figure 5.7 Typical time history of structural displacement resulting from horizontal
ground motion (an earthquake).
Since ground velocity is commonly used as a measure of structural damage
(Wiss, 1981), a peak ground velocity based on vroax is defined for this purpose.
This is the pseudovelocity Sv given by
— U^O^max
(5.78)
A typical plot of the pseudovelocity is shown in Figure 5.8 as a function of the
structure’s period, 7q — 27v/u>q. It is noted that Sv is strongly dépendent on the
structural damping
From plots such as these, the peak horizontal shear load
/max at the sea floor, and the peak overturning moment Mmaj( can be estimated
from
max — ^l^max
(5.79)
Afmax — ^û/max — h()k\ ^max
(5.80)
where hq is the height of the platform.
121
is given to sufficient accuracy (without considération to initial conditions) by
équation (5.76), or
1 r
v(t) = —
v9(r)e“Cü/o(t_T) sin- r)dr
JO
(5-77)
For a structure with known characteristics üj0 and
then u>4 is calculated
from équation (5.71). Given an earthquake measurement of vg, the response
of this structure can then be calculated from the last équation by numerical
intégration. Such results are available in the open literature (Wiegel, 1970).
For instance, the measured time history of vg for the SOOE component of the
1940 El Centro earthquake shown in Figure 2.14 was used with équation (5.77)
to calculate several response historiés v(t), one for each fixed pair (£,^o)- For
each response history there is a maximum value of structural displacement
which occurs once during the time of excitation. Such a resuit is shown in Figure
5.7.
(Ç, œ0) fixed
Figure 5.7 Typical time history of structural displacement resulting from horizontal
ground motion (an earthquake).
Since ground velocity is commonly used as a measure of structural damage
(Wiss, 1981), a peak ground velocity based on vroax is defined for this purpose.
This is the pseudovelocity Sv given by
— U^O^max
(5.78)
A typical plot of the pseudovelocity is shown in Figure 5.8 as a function of the
structure’s period, 7q — 27v/u>q. It is noted that Sv is strongly dépendent on the
structural damping
From plots such as these, the peak horizontal shear load
/max at the sea floor, and the peak overturning moment Mmaj( can be estimated
from
max — ^l^max
(5.79)
Afmax — ^û/max — h()k\ ^max
(5.80)
where hq is the height of the platform.