

SUMMARY OF FLOW COEFFICIENTS
93
4.4
SUMMARY OF FLOW COEFFICIENTS CD AND CM
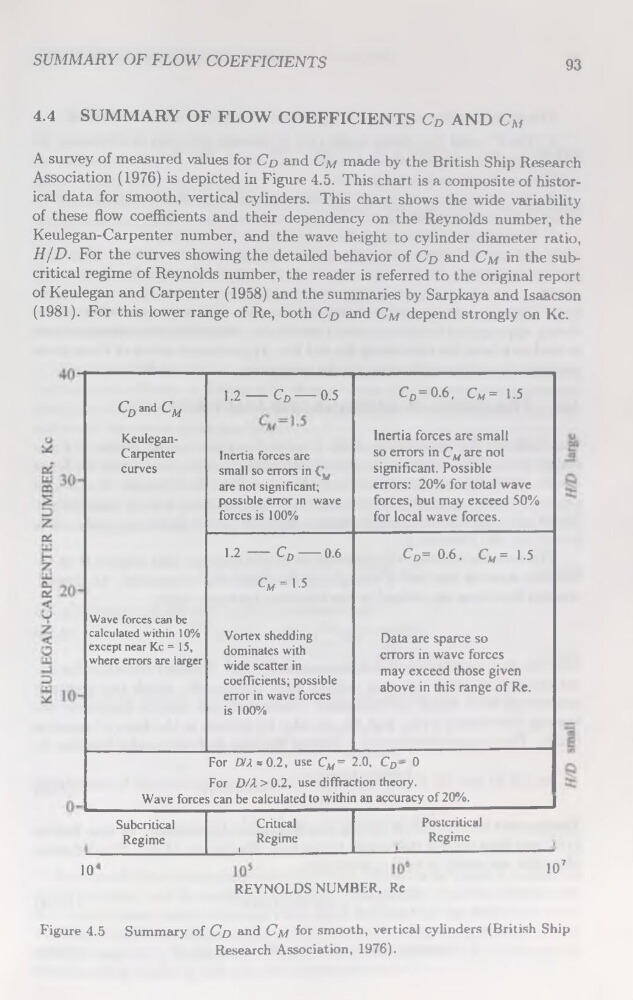
A survey of measured values for CD and CM made by the British Ship Research
Association (1976) is depicted in Figure 4.5. This chart is a composite of historical data for smooth, vertical cylinders. This chart shows the wide variability
of these flow coefficients and their dependency on the Reynolds number, the
Keulegan-Carpenter number, and the wave height to cylinder diameter ratio,
H/D. For the curves showing the detailed behavior of CD and CM in the subcritical régime of Reynolds number, the reader is referred to the original report
of Keulegan and Carpenter (1958) and the summaries by Sarpkaya and Isaacson
(1981). For this lower range of Re, both Cd and Cm dépend strongly on Kc.
CD and CM
KeuleganCarpenter
curves
Wave forces can be
calculated within 10%
except near Kc = 15,
where errors are larger
1.2----- CD------ 0.5
Inertia forces are
small so errors in Cv
are not significant;
possible error in wave
forces is 100%
CD= 0.6, CM = 1.5
Inertia forces are small
so errors in CM are not
significant. Possible
errors: 20% for total wave
forces, but may exceed 50%
for local wave forces.
1.2 ----- CD----- 0.6
Cm=1.5
Vortex shedding
dominâtes with
wide scatter in
coefficients; possible
error in wave forces
is 100%
CD= 0.6, Cw= 1.5
Data are sparce so
errors in wave forces
may exceed those given
above in this range of Re.
For DIX s 0.2, use CM= 2.0. CD- 0
For D/2 > 0.2, use diffraction theory.
Wave forces can be calculated to within an accuracy of20%.
10
Subcritical
Critical
Postcritical
Régime
Régime
i
-
Régime
1
_
’
REYNOLDS NUMBER, Re
I07
Figure 4.5 Summary of Cd and Cm for smooth, vertical cylinders (British Ship
Research Association, 1976).
93
4.4
SUMMARY OF FLOW COEFFICIENTS CD AND CM
A survey of measured values for CD and CM made by the British Ship Research
Association (1976) is depicted in Figure 4.5. This chart is a composite of historical data for smooth, vertical cylinders. This chart shows the wide variability
of these flow coefficients and their dependency on the Reynolds number, the
Keulegan-Carpenter number, and the wave height to cylinder diameter ratio,
H/D. For the curves showing the detailed behavior of CD and CM in the subcritical régime of Reynolds number, the reader is referred to the original report
of Keulegan and Carpenter (1958) and the summaries by Sarpkaya and Isaacson
(1981). For this lower range of Re, both Cd and Cm dépend strongly on Kc.
CD and CM
KeuleganCarpenter
curves
Wave forces can be
calculated within 10%
except near Kc = 15,
where errors are larger
1.2----- CD------ 0.5
Inertia forces are
small so errors in Cv
are not significant;
possible error in wave
forces is 100%
CD= 0.6, CM = 1.5
Inertia forces are small
so errors in CM are not
significant. Possible
errors: 20% for total wave
forces, but may exceed 50%
for local wave forces.
1.2 ----- CD----- 0.6
Cm=1.5
Vortex shedding
dominâtes with
wide scatter in
coefficients; possible
error in wave forces
is 100%
CD= 0.6, Cw= 1.5
Data are sparce so
errors in wave forces
may exceed those given
above in this range of Re.
For DIX s 0.2, use CM= 2.0. CD- 0
For D/2 > 0.2, use diffraction theory.
Wave forces can be calculated to within an accuracy of20%.
10
Subcritical
Critical
Postcritical
Régime
Régime
i
-
Régime
1
_
’
REYNOLDS NUMBER, Re
I07
Figure 4.5 Summary of Cd and Cm for smooth, vertical cylinders (British Ship
Research Association, 1976).