

76
Chemical Oceanography, 4th Edition
of S T for sea water diluted with pure water to dilute solutions. It also should prove useful in
characterizing the salinity of rivers and dilute lakes.
These results indicate that it is possible to make reasonable estimates of the true salinity
of an estuarine system if the composition of the river end member is known. For careful
work, laboratory mixing experiments should be made, especially when the composition of
the river end member is not known. As mentioned, one should calibrate the salinometer
with sea water diluted with pure water to be sure it is working properly in dilute solutions.
The maximum error is 35 × 10 –6 g cm –3 in density. If the comparisons are made at the
same S T , the differences are within ±3 × 10 –6 g cm –3 . Salinities derived from density will
be reliable only when the river salts have an effect on density similar to that of sea salts.
This is true for average river waters, but not for every river. The St. Lawrence River waters
Year
1900 1910 1920 1930 1940 1950 1960 1970
Oxygen (µM)
0
30
60
90
120
150
180
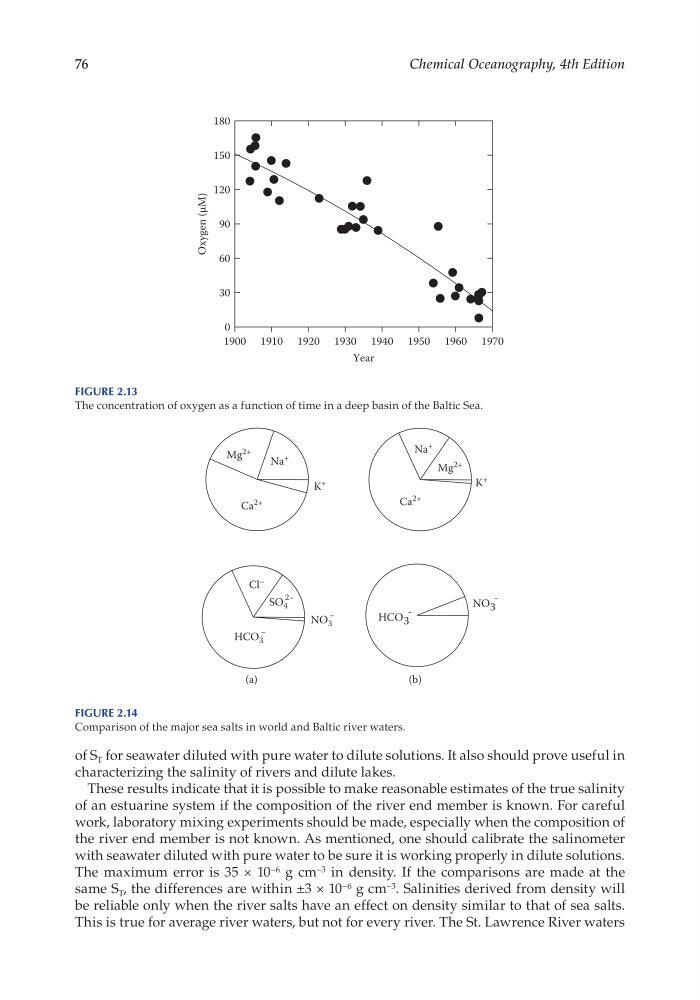
Figure 2.13
The concentration of oxygen as a function of time in a deep basin of the Baltic Sea.
Mg
2+
SO 4
2–
Cl
–
NO 3
–
HCO 3
–
Mg
2+
Ca
2+
Ca
2+
Na
+
Na
+
K
+
K
+
HCO 3
-
NO 3
-
(a)
(b)
Figure 2.14
Comparison of the major sea salts in world and Baltic river waters.
Chemical Oceanography, 4th Edition
of S T for sea water diluted with pure water to dilute solutions. It also should prove useful in
characterizing the salinity of rivers and dilute lakes.
These results indicate that it is possible to make reasonable estimates of the true salinity
of an estuarine system if the composition of the river end member is known. For careful
work, laboratory mixing experiments should be made, especially when the composition of
the river end member is not known. As mentioned, one should calibrate the salinometer
with sea water diluted with pure water to be sure it is working properly in dilute solutions.
The maximum error is 35 × 10 –6 g cm –3 in density. If the comparisons are made at the
same S T , the differences are within ±3 × 10 –6 g cm –3 . Salinities derived from density will
be reliable only when the river salts have an effect on density similar to that of sea salts.
This is true for average river waters, but not for every river. The St. Lawrence River waters
Year
1900 1910 1920 1930 1940 1950 1960 1970
Oxygen (µM)
0
30
60
90
120
150
180
Figure 2.13
The concentration of oxygen as a function of time in a deep basin of the Baltic Sea.
Mg
2+
SO 4
2–
Cl
–
NO 3
–
HCO 3
–
Mg
2+
Ca
2+
Ca
2+
Na
+
Na
+
K
+
K
+
HCO 3
-
NO 3
-
(a)
(b)
Figure 2.14
Comparison of the major sea salts in world and Baltic river waters.