

75
Composition of the Major Components of Seawater
The values of the practical conductivity salinity of the estuarine mixtures were found to
be related by
S COND = 0.044 + 1.803898 Cl(‰)
(2.33)
while the values of salinity determined by density were given by
S DENS = 0.092 + 1.80186 Cl(‰)
(2.34)
The differences between S A and S P or S ρ are shown in Figure 2.17. The values of salinity determined by density are in excellent agreement with the true salinity. These results
indicate that density- derived salinities are more reliable for typical estuarine solutions
than conductivity values. The lower values of S COND are related to the differences in the
equivalent conductance of the main components of sea water and world river water (see
Table 2.8). The conductances of Na + and Cl – are larger than Mg 2+ , Ca 2+ , and HCO 3
– ; thus, at
a given Cl(‰), the conductance of sea water diluted with pure water is greater than that of
estuarine waters. Below Cl(‰) = 2.0, the conductivity of river water is 0.94 ± 0.02 lower than
sea water diluted to the same Cl(‰). This can be compared to Λ° RW / Λ° SW = 0.88 calculated
from infinite dilution conductivity data. Part of this difference is related to the limitation
of the practical salinity scale to S = 2.000. The scale can be extended to lower salinities by
using the equation
S S
a
X X
b f t
Y
Y Y
PSS
=
− +
+
− +
+ +
0
2
0
1 2
3 2
1 1 5
1
.
( )
/
/
(2.35)
where S PSS is the value determined from the practical salinity scale given previously, and
the other parameters are given by a 0 = 0.0080, b 0 = 0.0005, X = 400 R T , Y = 100 R T , and f(t) =
(t – 15)/[1 – 0.0162(t – 25)]. The addition of this term allows one to calculate reliable values
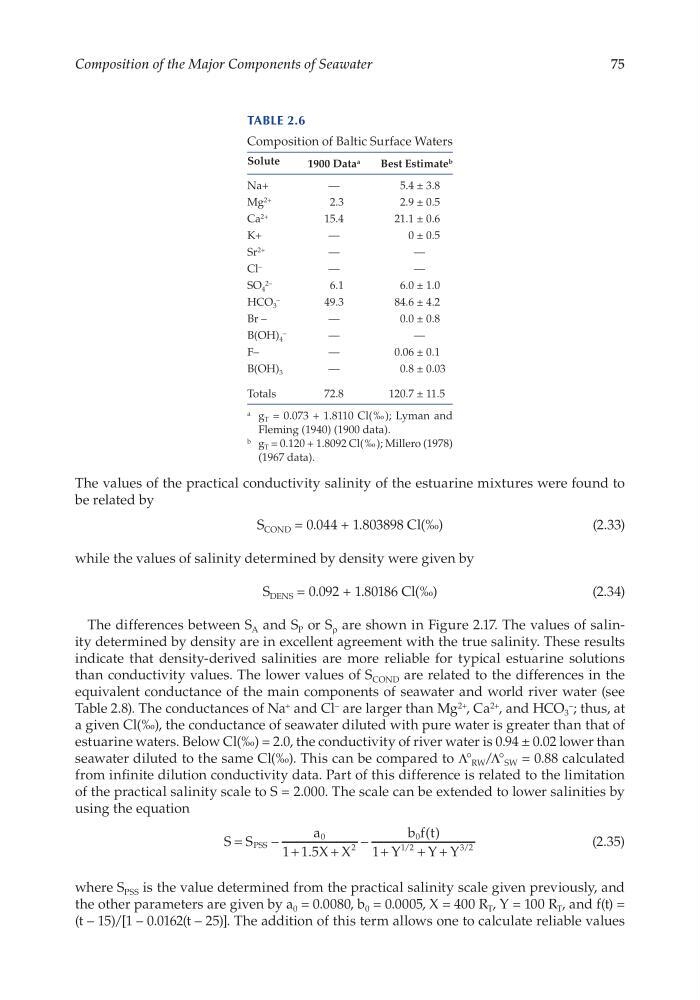
Table 2.6
Composition of Baltic Surface Waters
Solute
1900 Data a
Best Estimate b
Na+
—
5.4 ± 3.8
Mg 2+
2.3
2.9 ± 0.5
Ca 2+
15.4
21.1 ± 0.6
K+
—
0 ± 0.5
Sr 2+
—
—
Cl –
—
—
SO 4
2–
6.1
6.0 ± 1.0
HCO 3
–
49.3
84.6 ± 4.2
Br –
—
0.0 ± 0.8
B(OH) 4
–
—
—
F–
—
0.06 ± 0.1
B(OH) 3
—
0.8 ± 0.03
Totals
72.8
120.7 ± 11.5
a g T = 0.073 + 1.8110 Cl(‰); Lyman and
Fleming (1940) (1900 data).
b g T = 0.120 + 1.8092 Cl(‰); Millero (1978)
(1967 data).
Composition of the Major Components of Seawater
The values of the practical conductivity salinity of the estuarine mixtures were found to
be related by
S COND = 0.044 + 1.803898 Cl(‰)
(2.33)
while the values of salinity determined by density were given by
S DENS = 0.092 + 1.80186 Cl(‰)
(2.34)
The differences between S A and S P or S ρ are shown in Figure 2.17. The values of salinity determined by density are in excellent agreement with the true salinity. These results
indicate that density- derived salinities are more reliable for typical estuarine solutions
than conductivity values. The lower values of S COND are related to the differences in the
equivalent conductance of the main components of sea water and world river water (see
Table 2.8). The conductances of Na + and Cl – are larger than Mg 2+ , Ca 2+ , and HCO 3
– ; thus, at
a given Cl(‰), the conductance of sea water diluted with pure water is greater than that of
estuarine waters. Below Cl(‰) = 2.0, the conductivity of river water is 0.94 ± 0.02 lower than
sea water diluted to the same Cl(‰). This can be compared to Λ° RW / Λ° SW = 0.88 calculated
from infinite dilution conductivity data. Part of this difference is related to the limitation
of the practical salinity scale to S = 2.000. The scale can be extended to lower salinities by
using the equation
S S
a
X X
b f t
Y
Y Y
PSS
=
− +
+
− +
+ +
0
2
0
1 2
3 2
1 1 5
1
.
( )
/
/
(2.35)
where S PSS is the value determined from the practical salinity scale given previously, and
the other parameters are given by a 0 = 0.0080, b 0 = 0.0005, X = 400 R T , Y = 100 R T , and f(t) =
(t – 15)/[1 – 0.0162(t – 25)]. The addition of this term allows one to calculate reliable values
Table 2.6
Composition of Baltic Surface Waters
Solute
1900 Data a
Best Estimate b
Na+
—
5.4 ± 3.8
Mg 2+
2.3
2.9 ± 0.5
Ca 2+
15.4
21.1 ± 0.6
K+
—
0 ± 0.5
Sr 2+
—
—
Cl –
—
—
SO 4
2–
6.1
6.0 ± 1.0
HCO 3
–
49.3
84.6 ± 4.2
Br –
—
0.0 ± 0.8
B(OH) 4
–
—
—
F–
—
0.06 ± 0.1
B(OH) 3
—
0.8 ± 0.03
Totals
72.8
120.7 ± 11.5
a g T = 0.073 + 1.8110 Cl(‰); Lyman and
Fleming (1940) (1900 data).
b g T = 0.120 + 1.8092 Cl(‰); Millero (1978)
(1967 data).