

45
Descriptive Oceanography
anthropogenic produced CO 2 in the world ocean. The measurements of the CFCs made
during the global survey of the WOCE and CLIVAR programs will lead to a tracer field
that can be used to evaluate global models and will improve our understanding of the
rates and pathways of ocean circulation and the response to changes in the global climate.
1.5.4 The age of Water Masses
A summary of the major water masses in the world ocean is given in Figures 1.52, 1.53, and
1.54. These figures are based on the water properties of the ocean waters. For a number
of years, many workers have attempted to estimate the age of the deep- water masses in
the world oceans using transient tracers like 14 C. The difference in concentration of 14 C
in various reservoirs allows one to establish the rate of mixing across the thermocline
and between various water masses. In the simplest case, the ocean can be considered to
be made of two boxes (a surface box and a deep box). Three substances must be conserved
between these boxes (water, C, and 14 C). It is also assumed that the sizes and carbon contents are constant with time. Because 14 C is decaying with time, its distribution between
the surface and deep boxes depends on the mixing. This leads to three equations. The rates
R are given by (Broecker and Peng, 1982)
R up = R down = R mix
(1.6)
0
1.5
0.5
1.5
1
2
2.5
1000
2000
3000
4000
5000
6000
Depth [M]
60°S
40°S
20°S
EQ
20°N
40°N
3
2
1
0
Ocean Data View
CFC-12 [PMOL/KG]
CFC-12 [PMOL/KG]
60°N
0
1000
2000
3000
4000
5000
6000
Depth [M]
60°S
40°S
20°S
EQ
20°N
40°N
3
4
2
1
0
Ocean Data View
1.5
2.5
1.5
0.5
2
2.5
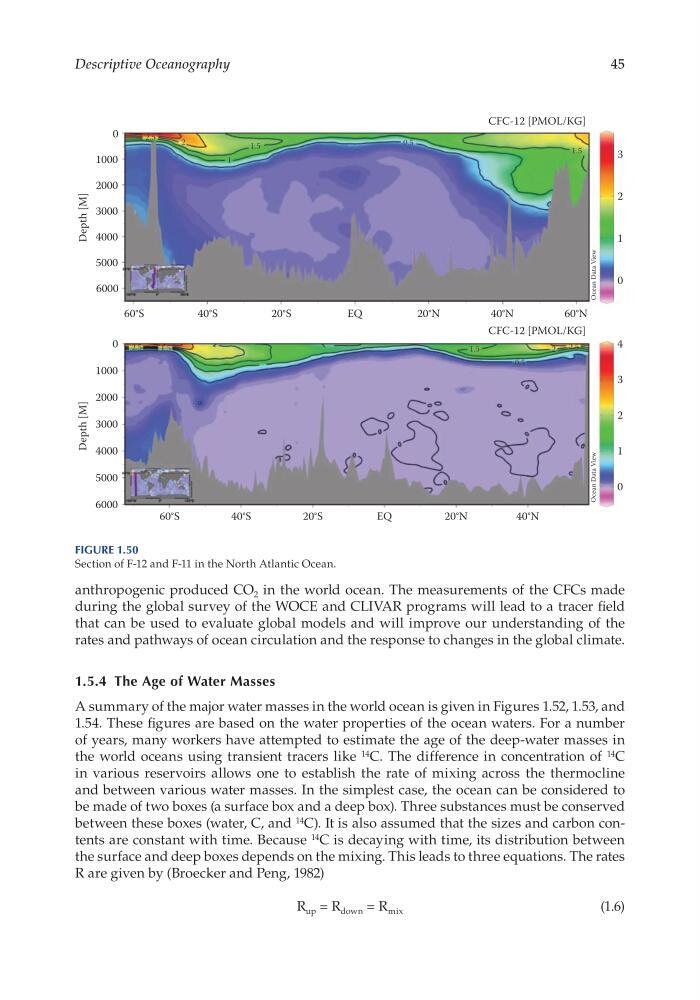
Figure 1.50
Section of F-12 and F-11 in the North Atlantic Ocean.
Descriptive Oceanography
anthropogenic produced CO 2 in the world ocean. The measurements of the CFCs made
during the global survey of the WOCE and CLIVAR programs will lead to a tracer field
that can be used to evaluate global models and will improve our understanding of the
rates and pathways of ocean circulation and the response to changes in the global climate.
1.5.4 The age of Water Masses
A summary of the major water masses in the world ocean is given in Figures 1.52, 1.53, and
1.54. These figures are based on the water properties of the ocean waters. For a number
of years, many workers have attempted to estimate the age of the deep- water masses in
the world oceans using transient tracers like 14 C. The difference in concentration of 14 C
in various reservoirs allows one to establish the rate of mixing across the thermocline
and between various water masses. In the simplest case, the ocean can be considered to
be made of two boxes (a surface box and a deep box). Three substances must be conserved
between these boxes (water, C, and 14 C). It is also assumed that the sizes and carbon contents are constant with time. Because 14 C is decaying with time, its distribution between
the surface and deep boxes depends on the mixing. This leads to three equations. The rates
R are given by (Broecker and Peng, 1982)
R up = R down = R mix
(1.6)
0
1.5
0.5
1.5
1
2
2.5
1000
2000
3000
4000
5000
6000
Depth [M]
60°S
40°S
20°S
EQ
20°N
40°N
3
2
1
0
Ocean Data View
CFC-12 [PMOL/KG]
CFC-12 [PMOL/KG]
60°N
0
1000
2000
3000
4000
5000
6000
Depth [M]
60°S
40°S
20°S
EQ
20°N
40°N
3
4
2
1
0
Ocean Data View
1.5
2.5
1.5
0.5
2
2.5
Figure 1.50
Section of F-12 and F-11 in the North Atlantic Ocean.