

500
Chemical Oceanography, 4th Edition
The overall rate equations for H 2 S, SO 3
2– , S 2 O 3
2– , and SO 4
2– are given by
d[H 2 S]/dt = –k 1 [H 2 S][O 2 ] – k 3 [H 2 S][SO 3
2– ][O 2 ]
(10.90)
d[SO 3
2– ]/dt = k 1 [H 2 S][O 2 ] – k 2 [SO 3
2– ] 2 [O 2 ] 1/2 – k 3 [H 2 S][SO 3
2– ][O 2 ]
(10.91)
d[S 2 O 3
2– ]/dt = k 3 [H 2 S][SO 3
2– ][O 2 ]
(10.92)
d[SO 4
2– ]/dt = k 2 [SO 3
2– ] 2 [O 2 ] 1/2
(10.93)
where [i] is the total concentration of i.
These rate equations have been integrated simultaneously to evaluate the values of k 1 ,
k 2 , and k 3 using the experimental time dependence concentrations of all the reactants and
products. The experimentally measured concentrations of H 2 S, SO 3
2– , S 2 O 3
2– , and SO 4
2–
were found to be in good agreement with the model predictions up to reaction times of
80 h (Figure 10.87). The values of k 2 in seawater needed to fit the data were slightly smaller
than the values determined in our previous study, especially at higher temperatures. This
was probably because of the inhibition of the oxidation of sulfite in the presence of sulfide.
This finding is supported by the previous observations that sulfite in the presence of H 2 S
is more stable in seawater than predicted by its rate of oxidation.
log [Fe(II)]
–7.5
–7.0
–6.5
–6.0
–5.5
log (k
1 )
1.0
1.5
2.0
2.5
3.0
log (k
3 )
0
1
2
3
log (k
2 )
4.0
4.5
5.0
5.5
Cariaco
Framvaren
Cariaco
Framvaren
Cariaco
Framvaren
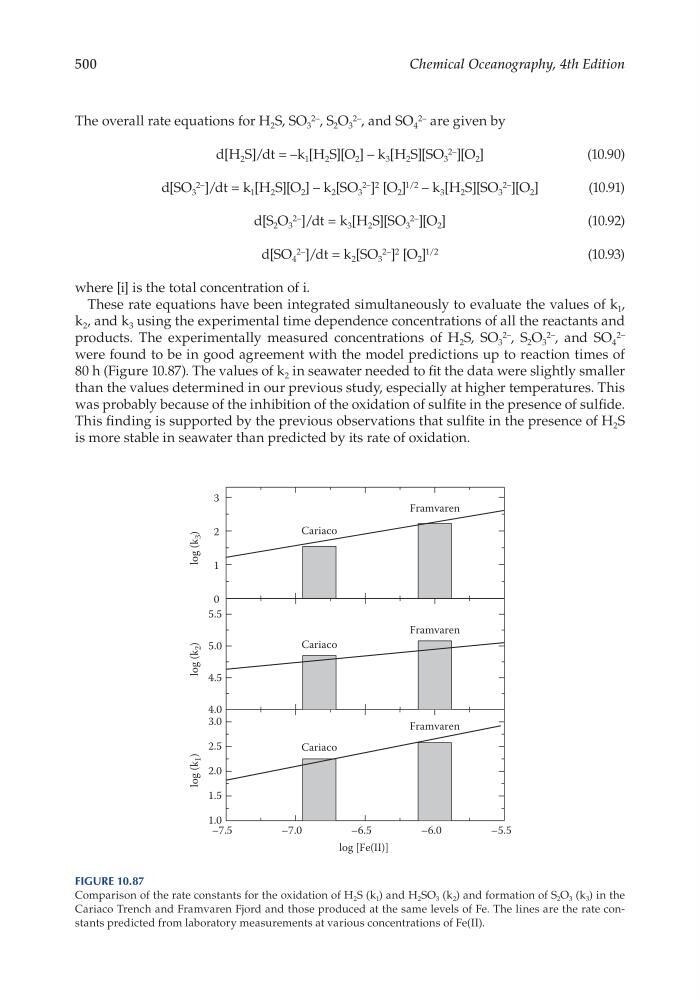
Figure 10.87
Comparison of the rate constants for the oxidation of H 2 S (k 1 ) and H 2 SO 3 (k 2 ) and formation of S 2 O 3 (k 3 ) in the
Cariaco Trench and Framvaren Fjord and those produced at the same levels of Fe. The lines are the rate constants predicted from laboratory measurements at various concentrations of Fe(II).
Chemical Oceanography, 4th Edition
The overall rate equations for H 2 S, SO 3
2– , S 2 O 3
2– , and SO 4
2– are given by
d[H 2 S]/dt = –k 1 [H 2 S][O 2 ] – k 3 [H 2 S][SO 3
2– ][O 2 ]
(10.90)
d[SO 3
2– ]/dt = k 1 [H 2 S][O 2 ] – k 2 [SO 3
2– ] 2 [O 2 ] 1/2 – k 3 [H 2 S][SO 3
2– ][O 2 ]
(10.91)
d[S 2 O 3
2– ]/dt = k 3 [H 2 S][SO 3
2– ][O 2 ]
(10.92)
d[SO 4
2– ]/dt = k 2 [SO 3
2– ] 2 [O 2 ] 1/2
(10.93)
where [i] is the total concentration of i.
These rate equations have been integrated simultaneously to evaluate the values of k 1 ,
k 2 , and k 3 using the experimental time dependence concentrations of all the reactants and
products. The experimentally measured concentrations of H 2 S, SO 3
2– , S 2 O 3
2– , and SO 4
2–
were found to be in good agreement with the model predictions up to reaction times of
80 h (Figure 10.87). The values of k 2 in seawater needed to fit the data were slightly smaller
than the values determined in our previous study, especially at higher temperatures. This
was probably because of the inhibition of the oxidation of sulfite in the presence of sulfide.
This finding is supported by the previous observations that sulfite in the presence of H 2 S
is more stable in seawater than predicted by its rate of oxidation.
log [Fe(II)]
–7.5
–7.0
–6.5
–6.0
–5.5
log (k
1 )
1.0
1.5
2.0
2.5
3.0
log (k
3 )
0
1
2
3
log (k
2 )
4.0
4.5
5.0
5.5
Cariaco
Framvaren
Cariaco
Framvaren
Cariaco
Framvaren
Figure 10.87
Comparison of the rate constants for the oxidation of H 2 S (k 1 ) and H 2 SO 3 (k 2 ) and formation of S 2 O 3 (k 3 ) in the
Cariaco Trench and Framvaren Fjord and those produced at the same levels of Fe. The lines are the rate constants predicted from laboratory measurements at various concentrations of Fe(II).