

491
Processes in the Oceans
chemocline. Dense populations of the phototrophic bacteria are present at the interface in
the Framvaren (Sørensen, 1988). It is not clear whether there are specific species among
them that can oxidize sulfide anaerobically. The third alternative process is horizontal
ventilation, which results from the water intrusion through the sill as discussed. Dissolved
oxygen in these ventilating injections could oxidize sulfide. Traces of the oxidation intermediates SO 3
2– and S 2 O 3
2– were found near the anoxic interface (Millero, 1991a). Such ventilation could account for the imbalance in the gradients of oxygen and sulfide.
The NTA (= TA × 35/S) and normalized TCO 2 (NTCO 2 = TCO 2 × 35/S) in the bottom
water of the Framvaren are about 12 times more than in the open ocean, suggesting an
enormous production of both TA and TCO 2 from oxidation of organic matter through the
reduction of sulfate. The value of NTA in the Framvaren surface water was 2.41 mM, which
is only slightly higher than the typical value of the open ocean (2.35 mM), while the NTCO 2
was much higher (2.31 mM) than the value of the open ocean (2.05 mM). Much higher values of both NTA (6.34 mM) and NTCO 2 (5.80 mM) were found in the surface water of the
Black Sea (Goyet, Bradshaw, and Brewer, 1991). As discussed by Dyrssen (1986), these high
values cannot result from the low salinity and high NTA of the river water mixing with
Mediterranean seawater. The lower NTA in the Framvaren surface water indicates that
the impact of freshwater was minor. The cause of the higher values of NTCO 2 in the surface waters may be the oxidation of organic matter in oxic water or diffusion from below
the interface.
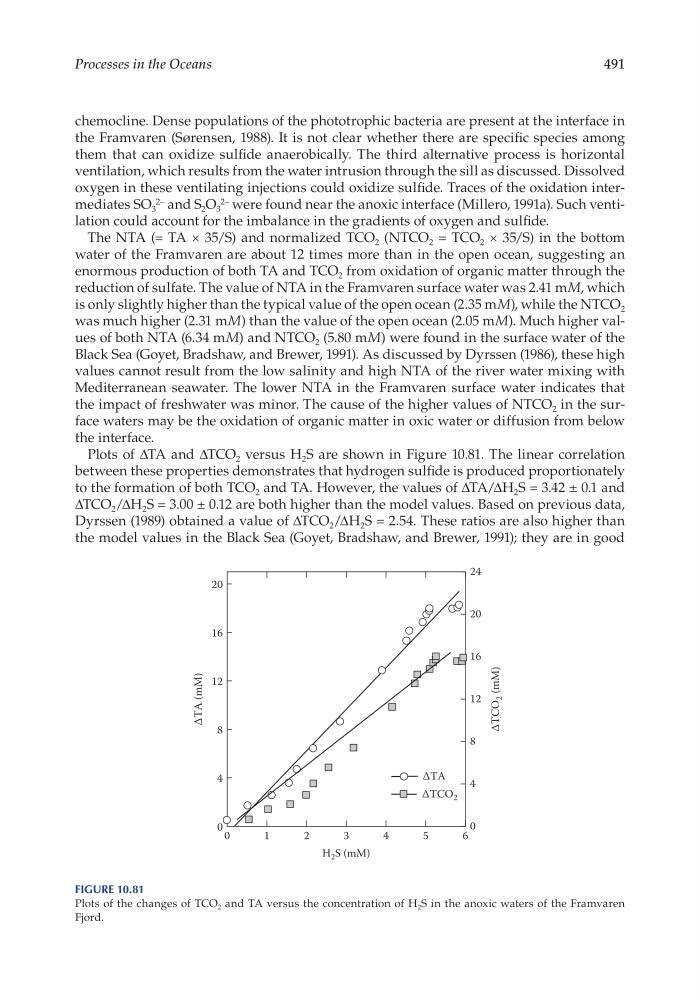
Plots of ΔTA and ΔTCO 2 versus H 2 S are shown in Figure 10.81. The linear correlation
between these properties demonstrates that hydrogen sulfide is produced proportionately
to the formation of both TCO 2 and TA. However, the values of ΔTA/ ΔH 2 S = 3.42 ± 0.1 and
ΔTCO 2 /ΔH 2 S = 3.00 ± 0.12 are both higher than the model values. Based on previous data,
Dyrssen (1989) obtained a value of ΔTCO 2 /ΔH 2 S = 2.54. These ratios are also higher than
the model values in the Black Sea (Goyet, Bradshaw, and Brewer, 1991); they are in good
0
4
8
12
16
20
24
∆TCO 2
∆TCO
2 (mM)
0
1
2
3
4
5
6
0
4
8
12
16
20
∆TA
∆TA (mM)
H 2 S (mM)
Figure 10.81
Plots of the changes of TCO 2 and TA versus the concentration of H 2 S in the anoxic waters of the Framvaren
Fjord.
Processes in the Oceans
chemocline. Dense populations of the phototrophic bacteria are present at the interface in
the Framvaren (Sørensen, 1988). It is not clear whether there are specific species among
them that can oxidize sulfide anaerobically. The third alternative process is horizontal
ventilation, which results from the water intrusion through the sill as discussed. Dissolved
oxygen in these ventilating injections could oxidize sulfide. Traces of the oxidation intermediates SO 3
2– and S 2 O 3
2– were found near the anoxic interface (Millero, 1991a). Such ventilation could account for the imbalance in the gradients of oxygen and sulfide.
The NTA (= TA × 35/S) and normalized TCO 2 (NTCO 2 = TCO 2 × 35/S) in the bottom
water of the Framvaren are about 12 times more than in the open ocean, suggesting an
enormous production of both TA and TCO 2 from oxidation of organic matter through the
reduction of sulfate. The value of NTA in the Framvaren surface water was 2.41 mM, which
is only slightly higher than the typical value of the open ocean (2.35 mM), while the NTCO 2
was much higher (2.31 mM) than the value of the open ocean (2.05 mM). Much higher values of both NTA (6.34 mM) and NTCO 2 (5.80 mM) were found in the surface water of the
Black Sea (Goyet, Bradshaw, and Brewer, 1991). As discussed by Dyrssen (1986), these high
values cannot result from the low salinity and high NTA of the river water mixing with
Mediterranean seawater. The lower NTA in the Framvaren surface water indicates that
the impact of freshwater was minor. The cause of the higher values of NTCO 2 in the surface waters may be the oxidation of organic matter in oxic water or diffusion from below
the interface.
Plots of ΔTA and ΔTCO 2 versus H 2 S are shown in Figure 10.81. The linear correlation
between these properties demonstrates that hydrogen sulfide is produced proportionately
to the formation of both TCO 2 and TA. However, the values of ΔTA/ ΔH 2 S = 3.42 ± 0.1 and
ΔTCO 2 /ΔH 2 S = 3.00 ± 0.12 are both higher than the model values. Based on previous data,
Dyrssen (1989) obtained a value of ΔTCO 2 /ΔH 2 S = 2.54. These ratios are also higher than
the model values in the Black Sea (Goyet, Bradshaw, and Brewer, 1991); they are in good
0
4
8
12
16
20
24
∆TCO 2
∆TCO
2 (mM)
0
1
2
3
4
5
6
0
4
8
12
16
20
∆TA
∆TA (mM)
H 2 S (mM)
Figure 10.81
Plots of the changes of TCO 2 and TA versus the concentration of H 2 S in the anoxic waters of the Framvaren
Fjord.