

478
Chemical Oceanography, 4th Edition
10.3.3 Framvaren Fjord
The Framvaren Fjord, located in southern Norway (Figure 10.66) is a permanent superanoxic fjord that has the highest levels of H 2 S (6 μM) reported for an open anoxic basin. The
catchment area (31 km 2 ) is dominated by granitic rock. The rock consists of quartz (20%),
microcline perthite (35%), oligoclas (36%), hornblende (5%), and accessory minerals. The
fjord (Figure 10.67) has a shallow 2-m sill that separates the outer Hellevikfjord (80 m)
from the basin, which is 183 m deep (Skei, 1988a). A major river entering the Lyngdalsfjord
causes a flow of freshwater through the canal into the Framvaren. In 1993, we conducted
chemical studies of the Framvaren Fjord (Yao and Millero, 1995). The large salinity gradient (Figure 10.68) accounts for the large pycnocline that separates the surface and deep
water. The surface waters have a salinity of 12, while the deep waters have salinities as
high as 24. The salinity gradient prevents vertical mixing and results in the formation of
H 2 S below a depth of about 18 m. The temperatures of the surface waters (Figure 10.68)
fluctuate from 0°C in the winter to 19°C in the summer. The deep waters have a uniform
temperature of 7 to 8°C. Based on the hydrography, the water masses can be divided into
four major layers: the low- salinity surface layer (0 to 2 m) above the sill depth; the intermediate oxygenated layer down to about 18 m; the deep water, where steep gradients in the
chemistry occur (18 to 90 m); and the bottom water below 90 m, where changes in salinity
and chemistry are small.
The deep basin has been anoxic for about 8000 years. The sill was dredged in 1850,
resulting in the formation of a new layer of H 2 S (Figure 10.69). A vertical section of O 2 and
H 2 S in the central basin is shown in Figure 10.70. A surface maximum is observed in O 2
resulting from the photosynthesis of phytoplankton. The O 2 goes to zero at about 18 m,
Time (y)
1960
1970
1980
1990
Concentration (µM)
0
20
40
60
80
100
SiO 2
H 2 S
NH 4
PO 4
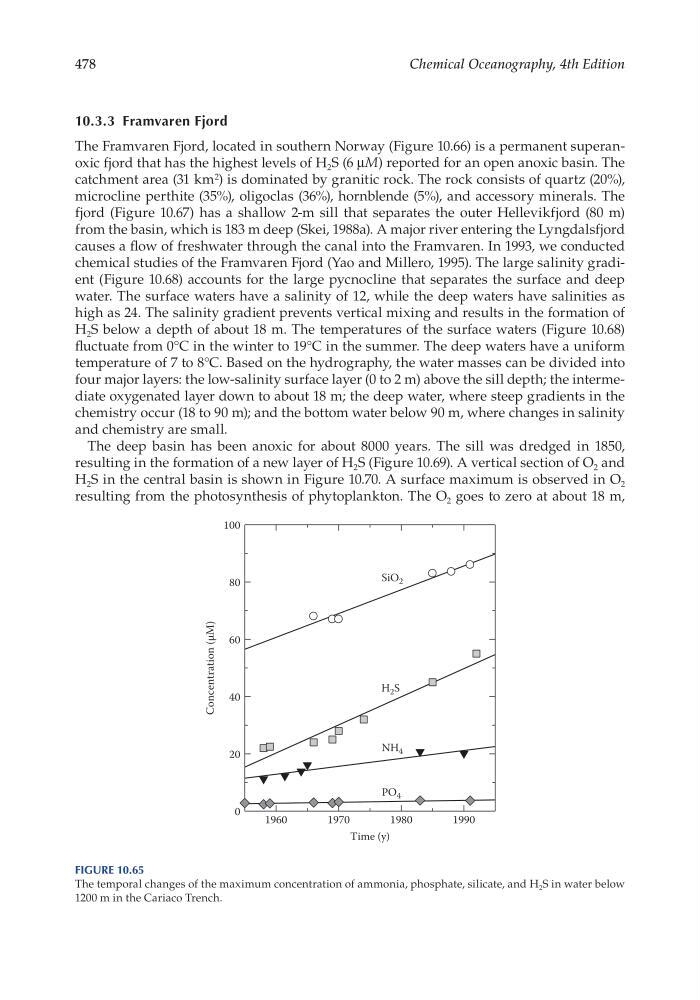
Figure 10.65
The temporal changes of the maximum concentration of ammonia, phosphate, silicate, and H 2 S in water below
1200 m in the Cariaco Trench.
Chemical Oceanography, 4th Edition
10.3.3 Framvaren Fjord
The Framvaren Fjord, located in southern Norway (Figure 10.66) is a permanent superanoxic fjord that has the highest levels of H 2 S (6 μM) reported for an open anoxic basin. The
catchment area (31 km 2 ) is dominated by granitic rock. The rock consists of quartz (20%),
microcline perthite (35%), oligoclas (36%), hornblende (5%), and accessory minerals. The
fjord (Figure 10.67) has a shallow 2-m sill that separates the outer Hellevikfjord (80 m)
from the basin, which is 183 m deep (Skei, 1988a). A major river entering the Lyngdalsfjord
causes a flow of freshwater through the canal into the Framvaren. In 1993, we conducted
chemical studies of the Framvaren Fjord (Yao and Millero, 1995). The large salinity gradient (Figure 10.68) accounts for the large pycnocline that separates the surface and deep
water. The surface waters have a salinity of 12, while the deep waters have salinities as
high as 24. The salinity gradient prevents vertical mixing and results in the formation of
H 2 S below a depth of about 18 m. The temperatures of the surface waters (Figure 10.68)
fluctuate from 0°C in the winter to 19°C in the summer. The deep waters have a uniform
temperature of 7 to 8°C. Based on the hydrography, the water masses can be divided into
four major layers: the low- salinity surface layer (0 to 2 m) above the sill depth; the intermediate oxygenated layer down to about 18 m; the deep water, where steep gradients in the
chemistry occur (18 to 90 m); and the bottom water below 90 m, where changes in salinity
and chemistry are small.
The deep basin has been anoxic for about 8000 years. The sill was dredged in 1850,
resulting in the formation of a new layer of H 2 S (Figure 10.69). A vertical section of O 2 and
H 2 S in the central basin is shown in Figure 10.70. A surface maximum is observed in O 2
resulting from the photosynthesis of phytoplankton. The O 2 goes to zero at about 18 m,
Time (y)
1960
1970
1980
1990
Concentration (µM)
0
20
40
60
80
100
SiO 2
H 2 S
NH 4
PO 4
Figure 10.65
The temporal changes of the maximum concentration of ammonia, phosphate, silicate, and H 2 S in water below
1200 m in the Cariaco Trench.