

475
Processes in the Oceans
over a period of 9 yr. This variation is small relative to the analytical error, and it is hard to
confirm the increasing pattern. The continuous decrease of salinity with depth in our data
suggests that the upward salt flux from the sediments is insignificant.
The concentrations of ammonia, phosphate, and silicate in the deep waters of the Cariaco
Trench have increased with time since the first measurements were made in the 1950s.
These temporal changes are also shown in Figure 10.65. The rates of increase are 0.282 μM
yr –1 for ammonia, 0.0372 μM yr –1 for phosphate, and 0.854 μM yr –1 for silicate. These increases
are consistent with the increase of H 2 S with time in the deep waters of the Cariaco Trench.
If these compounds behave conservatively, they should have accumulated in the anoxic
water column in fixed ratios as predicted. The ratio of the rate of increase for ammonia to
that of sulfide is equal to 0.25. Considering that these rates of increase are average values
taken over four decades, the ratio of the rates of increase for ammonia and sulfide are in
reasonable agreement with the value of 0.30 predicted from the model. The ratio of the rate
of increase for phosphate to that of sulfide is equal to 0.0335, while the theoretical value is
0.0189. The larger increase for phosphate suggests other sources besides the decomposition
of organic particulate materials such as the incorporation of PO 4
3– on Fe and Mn oxides
that sink below the interface. The dissolution of phosphate minerals in the anoxic water
or diffusion from sediment pore waters might also provide the input of the phosphate in
the anoxic waters. The flux of silicate from the pore water of the sediment into the water
column has been suggested as the cause of the high concentrations of silicate in the deep
waters of the Cariaco Trench (Fanning and Pilson, 1972; Scranton et al., 1987).
By extrapolating the concentrations of H 2 S and NH 4
+ to zero, it is possible to estimate the
last time that the trench was oxic. The earlier rate of increase (1955 to 1969) in the H 2 S with
time extrapolated to zero gives a date of 1916. A similar extrapolation for NH 4
+ gives a date
of 1914. These estimations, from two independent chemical compounds, are in good agreement for the last occurrence of a complete turnover of the trench waters. It is interesting to
Time (h)
0
2
4
6
8
10
12
14
16
ln [H
2 S]/[H
2 S]
o
–2.5
–2.0
–1.5
–1.0
–0.5
0.0
Mixed
Surface
Deep
t 1/2 = 17.3 ± 0.1 h
t 1/2 = 3.0 ± 0.1 h
t 1/2 = 1.5 ± 0.1 h
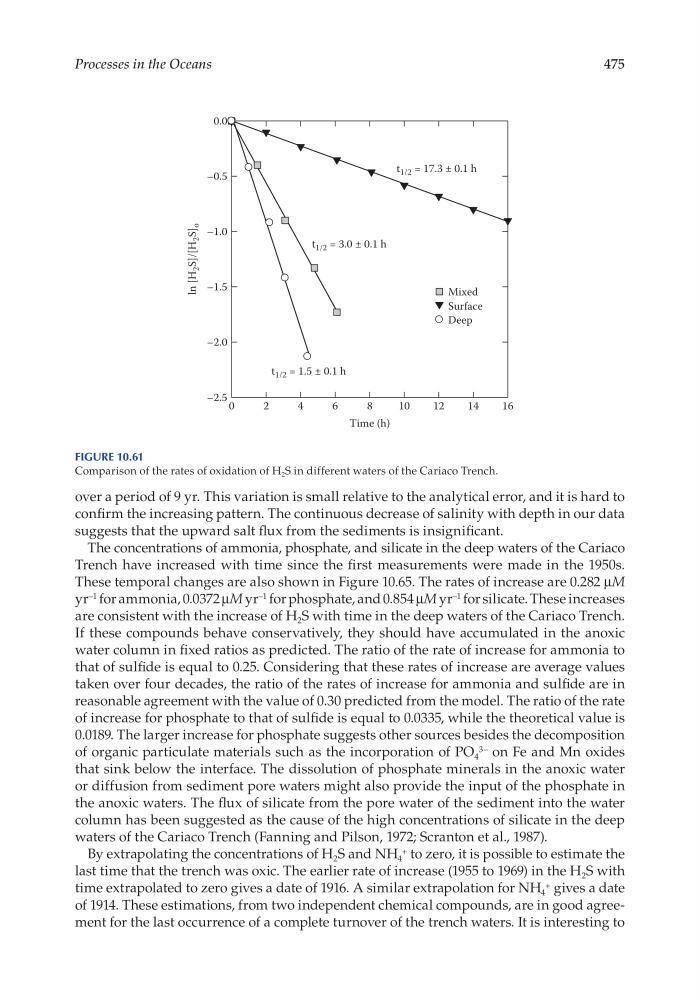
Figure 10.61
Comparison of the rates of oxidation of H 2 S in different waters of the Cariaco Trench.
Processes in the Oceans
over a period of 9 yr. This variation is small relative to the analytical error, and it is hard to
confirm the increasing pattern. The continuous decrease of salinity with depth in our data
suggests that the upward salt flux from the sediments is insignificant.
The concentrations of ammonia, phosphate, and silicate in the deep waters of the Cariaco
Trench have increased with time since the first measurements were made in the 1950s.
These temporal changes are also shown in Figure 10.65. The rates of increase are 0.282 μM
yr –1 for ammonia, 0.0372 μM yr –1 for phosphate, and 0.854 μM yr –1 for silicate. These increases
are consistent with the increase of H 2 S with time in the deep waters of the Cariaco Trench.
If these compounds behave conservatively, they should have accumulated in the anoxic
water column in fixed ratios as predicted. The ratio of the rate of increase for ammonia to
that of sulfide is equal to 0.25. Considering that these rates of increase are average values
taken over four decades, the ratio of the rates of increase for ammonia and sulfide are in
reasonable agreement with the value of 0.30 predicted from the model. The ratio of the rate
of increase for phosphate to that of sulfide is equal to 0.0335, while the theoretical value is
0.0189. The larger increase for phosphate suggests other sources besides the decomposition
of organic particulate materials such as the incorporation of PO 4
3– on Fe and Mn oxides
that sink below the interface. The dissolution of phosphate minerals in the anoxic water
or diffusion from sediment pore waters might also provide the input of the phosphate in
the anoxic waters. The flux of silicate from the pore water of the sediment into the water
column has been suggested as the cause of the high concentrations of silicate in the deep
waters of the Cariaco Trench (Fanning and Pilson, 1972; Scranton et al., 1987).
By extrapolating the concentrations of H 2 S and NH 4
+ to zero, it is possible to estimate the
last time that the trench was oxic. The earlier rate of increase (1955 to 1969) in the H 2 S with
time extrapolated to zero gives a date of 1916. A similar extrapolation for NH 4
+ gives a date
of 1914. These estimations, from two independent chemical compounds, are in good agreement for the last occurrence of a complete turnover of the trench waters. It is interesting to
Time (h)
0
2
4
6
8
10
12
14
16
ln [H
2 S]/[H
2 S]
o
–2.5
–2.0
–1.5
–1.0
–0.5
0.0
Mixed
Surface
Deep
t 1/2 = 17.3 ± 0.1 h
t 1/2 = 3.0 ± 0.1 h
t 1/2 = 1.5 ± 0.1 h
Figure 10.61
Comparison of the rates of oxidation of H 2 S in different waters of the Cariaco Trench.