

473
Processes in the Oceans
SO 3
2– , S 2 O 3
2– , and SO 4
2– occurring during the oxidation are similar to laboratory studies
and measurements in other anoxic basins. Plots of the concentration of NH 4
+ , PO 4
3– , and
ΔTCO 2 versus H 2 S in the anoxic waters of the Cariaco Trench are shown in Figure 10.63.
Good linear correlations were found with slopes of 0.33 ± 0.07 for NH 4
+ , 0.0191 ± 0.0014 for
PO 4
3– , and 2.25 ± 0.10 for TCO 2 . These slopes are in good agreement with the theoretical
values (0.30 for NH 4
+ , 0.0189 for PO 4
3– , and 2.00 for TCO 2 ). Corrections for total sulfur to
include sulfite and thiosulfate slightly improved the values of the ratios (0.31 ± 0.06 for
NH 4
+ , 0.0182 ± 0.0014, and 2.01 ± 0.07 for total CO 2 ). Since decreases in the concentration of
sulfide could also occur due to reactions with MnO 2 and FeOOH, we cannot rule out that
this effect may be responsible for the slightly larger slopes found without any corrections.
A plot of the concentration of silicate versus H 2 S in the anoxic water is also shown in
Figure 10.63. The linear correlation between sulfide and silicate in the anoxic water gives a
slope of 0.91 ± 0.07. There is no theoretical ratio of H 2 S to Si from the oxidation of biogenic
organic matter because of its dependence on the relative abundance of siliceous organisms
(e.g., diatoms) in the phytoplankton population of the surface water. The population of
siliceous organisms varies temporally and spatially. From the profile of silicate, it can be
estimated that about 50% of the silicate is regenerated above the oxic–anoxic interface.
Another 50% of the silicate is released in the anoxic waters below the interface. Small
amounts of silicate may be released from the sediments as sulfide is produced. Little is
known about the effect of anoxic environments on the dissolution of silicate.
Scranton et al. (1987) suggested that the physical and chemical properties of the deep
waters of the Cariaco Trench are increasing. For example, there has been a significant
change in the temperature distribution over 35 years since the first expedition in 1955.
There has been a distinct increase in the temperature of the waters below 1000 m as well as
Concentration (µM)
0.0
0.4
0.8
1.2
1.6
2.0
Depth (m)
0
200
400
600
800
1000
1200
1400
S 2 O 3
2–
SO 3
2–
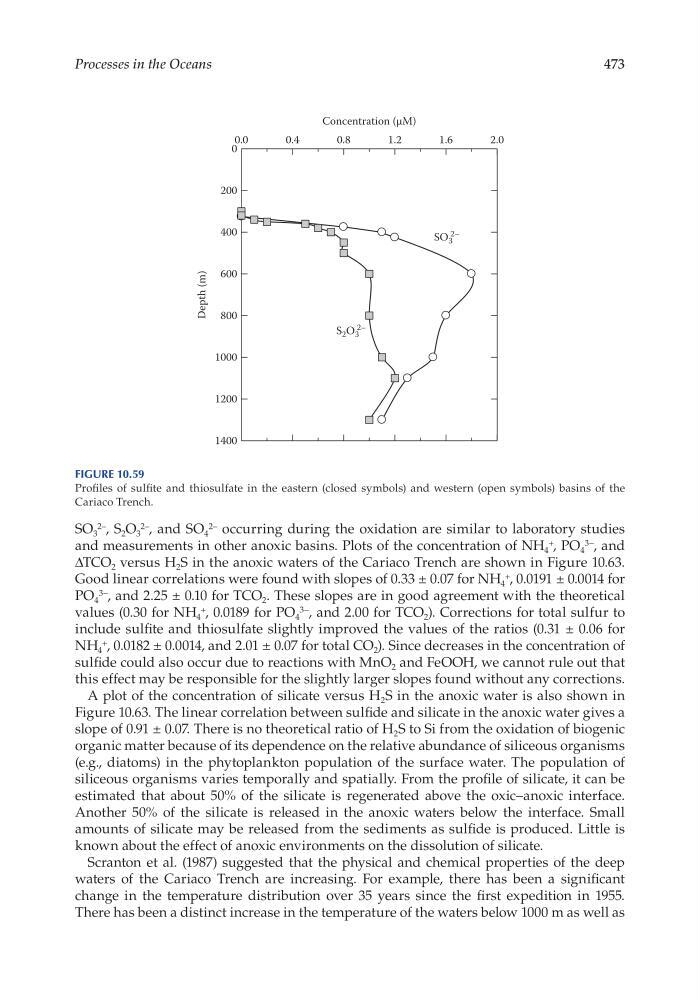
Figure 10.59
Profiles of sulfite and thiosulfate in the eastern (closed symbols) and western (open symbols) basins of the
Cariaco Trench.
Processes in the Oceans
SO 3
2– , S 2 O 3
2– , and SO 4
2– occurring during the oxidation are similar to laboratory studies
and measurements in other anoxic basins. Plots of the concentration of NH 4
+ , PO 4
3– , and
ΔTCO 2 versus H 2 S in the anoxic waters of the Cariaco Trench are shown in Figure 10.63.
Good linear correlations were found with slopes of 0.33 ± 0.07 for NH 4
+ , 0.0191 ± 0.0014 for
PO 4
3– , and 2.25 ± 0.10 for TCO 2 . These slopes are in good agreement with the theoretical
values (0.30 for NH 4
+ , 0.0189 for PO 4
3– , and 2.00 for TCO 2 ). Corrections for total sulfur to
include sulfite and thiosulfate slightly improved the values of the ratios (0.31 ± 0.06 for
NH 4
+ , 0.0182 ± 0.0014, and 2.01 ± 0.07 for total CO 2 ). Since decreases in the concentration of
sulfide could also occur due to reactions with MnO 2 and FeOOH, we cannot rule out that
this effect may be responsible for the slightly larger slopes found without any corrections.
A plot of the concentration of silicate versus H 2 S in the anoxic water is also shown in
Figure 10.63. The linear correlation between sulfide and silicate in the anoxic water gives a
slope of 0.91 ± 0.07. There is no theoretical ratio of H 2 S to Si from the oxidation of biogenic
organic matter because of its dependence on the relative abundance of siliceous organisms
(e.g., diatoms) in the phytoplankton population of the surface water. The population of
siliceous organisms varies temporally and spatially. From the profile of silicate, it can be
estimated that about 50% of the silicate is regenerated above the oxic–anoxic interface.
Another 50% of the silicate is released in the anoxic waters below the interface. Small
amounts of silicate may be released from the sediments as sulfide is produced. Little is
known about the effect of anoxic environments on the dissolution of silicate.
Scranton et al. (1987) suggested that the physical and chemical properties of the deep
waters of the Cariaco Trench are increasing. For example, there has been a significant
change in the temperature distribution over 35 years since the first expedition in 1955.
There has been a distinct increase in the temperature of the waters below 1000 m as well as
Concentration (µM)
0.0
0.4
0.8
1.2
1.6
2.0
Depth (m)
0
200
400
600
800
1000
1200
1400
S 2 O 3
2–
SO 3
2–
Figure 10.59
Profiles of sulfite and thiosulfate in the eastern (closed symbols) and western (open symbols) basins of the
Cariaco Trench.